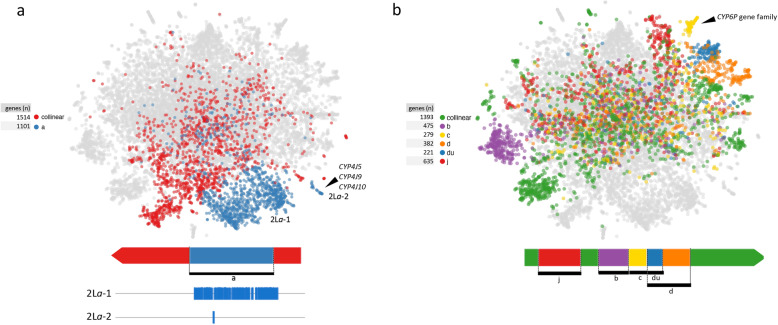
Fig. 5.
Chromosome 2 and its inversions. a t-SNE plot highlighting genes on the 2L chromosome arm, colors correspond to the genomic regions: outside inversion i.e. collinear (red), within inversion 2La (blue). Within 2La inversion: 2La-1 showed as a large cluster and 2La-2 as an small isolated cluster. b t-SNE plot highlighting genes on the 2R chromosome arm-colors correspond to the genomic region: outside inversions i.e. collinear (green), inversions and inversions overlap (b, c, d, du, j). Black arrows indicate key genes referenced in the text

