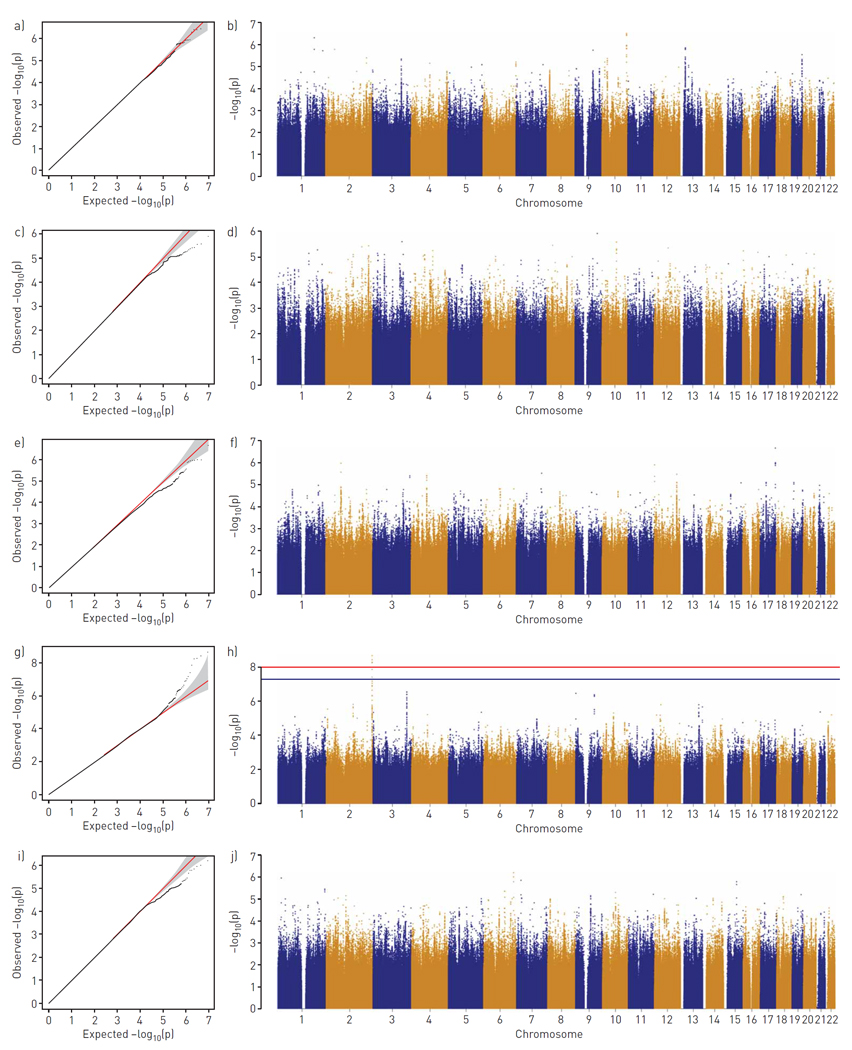
Figure 1.

Genome-wide association study based on 894 asthmatic Genetic Epidemiology of Asthma in Costa Rica Study trios for respiratory symptoms. a, b) Cough; c, d) phlegm; e, f) wheezing without cold; g, h) exertional dyspnoea; i, j) exertional chest tightness. Data visualised as quantile–quantile plots (a, c, e, g, i) and Manhattan plots (b, d, f, h, j). The red line corresponds to a Bonferroni-corrected genome-wide significance threshold for a total of five phenotypes (p=1.0×10⁻⁸) and the blue line indicates the commonly used genome-wide significance level (p=5×10⁻⁸).
