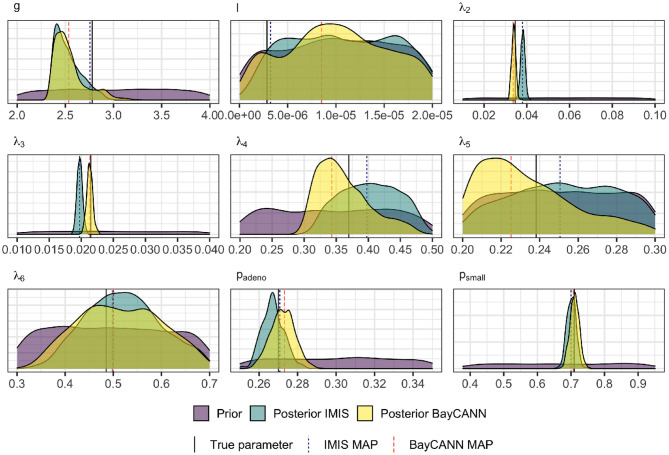
Figure 5.
Prior and Marginal posterior distributions of the calibrated parameters from the IMIS and BayCANN methods. The vertical solid lines indicate the “true” parameter values (i.e., the value of the parameters used to generate the calibration targets in the confirmatory analysis). The vertical dashed lines represent the maximum a posteriori (MAP) for BayCANN and the incremental mixture importance sampling (IMIS).

