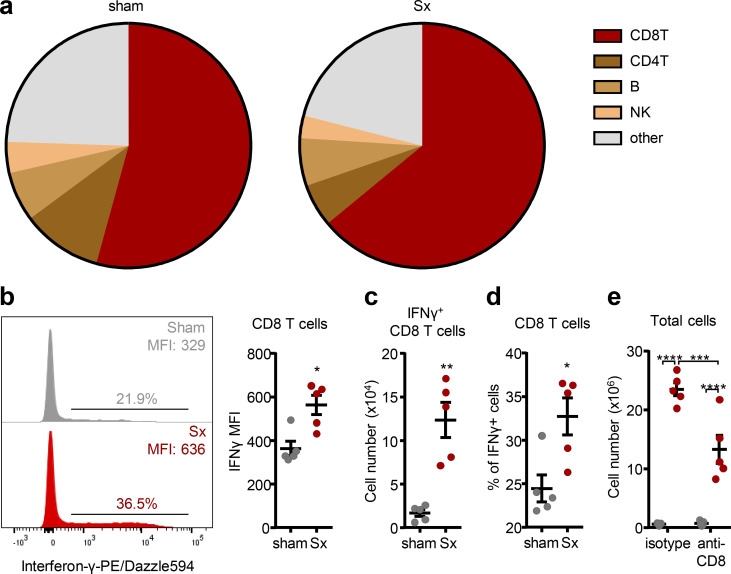
Figure 5.
CD8 T cells are the major producers of IFN-γ. (a) Subset composition of IFN-γ–expressing cells in the intact or denervated popLN. Data are presented as the mean of five mice; data are representative of two independent experiments. (b) Representative histogram and quantified geometric mean fluorescence intensity of IFN-γ in CD8 T cells; n = 5 mice; data are representative of two independent experiments; unpaired Student’s t test. (c and d) Cell number (c) and percentage (d) of IFN-γ–expressing cells in CD8 T cells; n = 5 mice; data are representative of two independent experiments; unpaired Student’s t test. (e) Cellularity of the popLN 1 wk after unilateral sciatic denervation with or without CD8 depletion; n = 5 mice; data are representative of two independent experiments; two-way ANOVA; Šídák’s post-test. All mice in this figure were 8–12-wk-old WT males purchased from Charles River or Janvier Labs. All data are presented as mean ± SEM; *, P < 0.05; **, P < 0.01; ***, P < 0.001; ****, P < 0.0001. MFI, mean fluorescence intensity; Sx, sciatic denervation.

