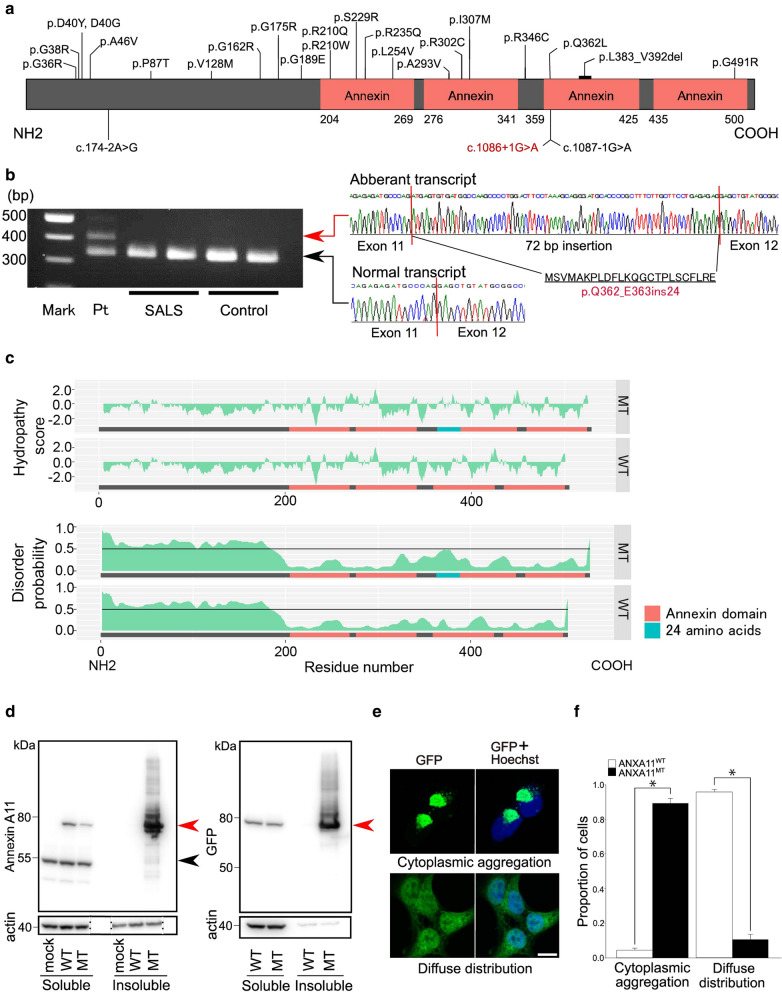
Fig. 2.
Position of the identified ANXA11 mutation and biological characteristics of the mutant annexin A11. a Annexin A11 protein domains and the position of mutations identified in patients with amyotrophic lateral sclerosis (ALS). Mutations found in the previous studies are in black and that of the present patient is in red. b An aberrant ANXA11 mRNA splicing as a consequence of the c.1086 + 1G > A mutation. Gel electrophoresis shows the reverse transcription PCR products from the autopsied brain of the present patient (Pt), patients with sporadic ALS harboring no ANXA11 mutations (SALS), and controls. The lane of Pt contains two different bands. Sequencing results show that the band located at 339 bp implies a normal transcript, and that located at 411 bp implies an aberrant transcript caused by 72-bp insertion between exons 11 and 12, numbered on the basis of ENSEMBL ANXA11-203. The inserted sequence results in a 24-amino-acid insertion. c Hydrophobicity and protein disorder predictions. Upper panel: Hydropathy plot [2] of the aberrant annexin A11 (MT) obtained using ExPASy shows increased hydrophobicity around the inserted 24-amino-acid site. Lower panel: Disorder profile plot of the aberrant annexin A11 (MT) obtained with PrDOS [1] shows increased disorder probability around the inserted 24-amino-acid site compared with that of the wild type (WT), indicating that the aberrant splicing could affect the stability and function of annexin A11. d Solubility fractionation of the cells transfected with GFP-tagged ANXA11 (GFP-ANXA11) constructs, followed by Western blotting using antibodies for (left) annexin A11 and (right) GFP. The wild type annexin A11 protein is predominantly soluble, whereas the mutant construct shows a prominent increase in the insoluble fraction. Red arrowhead: wild type (WT) and mutant (MT) GFP-annexin A11. Black arrowhead: endogenous annexin A11. β-Actin: loading control. e GFP-annexin A11 localization in HEK293T cells. Cells are classified according to GFP-annexin A11 localization patterns, i.e. cytoplasmic aggregation, and diffuse distribution. Bar = 10 µm for all images in e. f Proportion of cells showing each GFP-annexin A11 localization pattern. The proportion of cells showing cytoplasmic aggregation is significantly higher, and that of cells showing diffuse distribution is significantly lower in cells expressing GFP-annexin A11MT than in those expressing GFP-annexin A11WT (*, p < 0.002; Mann–Whitney U test)

