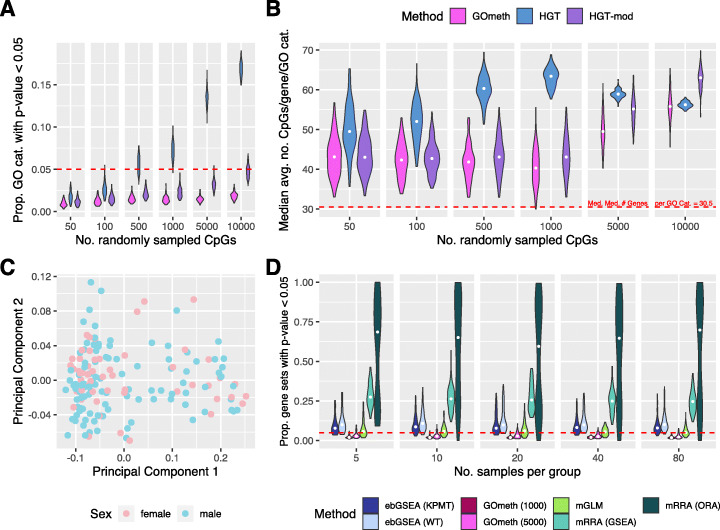
Fig. 3.
Evaluation of false discovery rate control for EPIC array data. A Type I error rates across 100 simulations for varying numbers of randomly sampled CpGs. B Median average numbers of CpGs per gene for GO categories with an unadjusted p value < 0.05. The hypergeometric test is biased towards GO categories with more CpGs per gene on average. GOmeth = adjust for probe-number and multi-gene bias; HGT = hypergeometric test; HGT-mod = adjust for probe-number bias only. C Multidimensional scaling plot of normal samples from TCGA KIRC data, colored by sex. D False discovery rate control of seven gene set testing methods using normal samples from TCGA KIRC data. Two groups were generated by randomly sampling n samples per group, followed by differential methylation analysis and subsequent gene set testing. This was repeated 100 times at each sample size. The proportion of gene sets with unadjusted p value < 0.05 across the 100 null simulations is shown for each method, at each sample size. Methods with good false discovery rate control should have relatively tight distributions around the red dashed line at 0.05. ebGSEA (KPMT) = ebGSEA using Known Population Median Test; ebGSEA (WT) = ebGSEA using Wilcoxon Test; GOmeth (1000) = GOmeth using top 1000 ranked probes; GOmeth (5000) = GOmeth using top 5000 ranked probes; mGLM = methylglm; mRRA (GSEA) = methylRRA using gene set enrichment analysis; mRRA (ORA) = methylRRA using over-representation analysis

