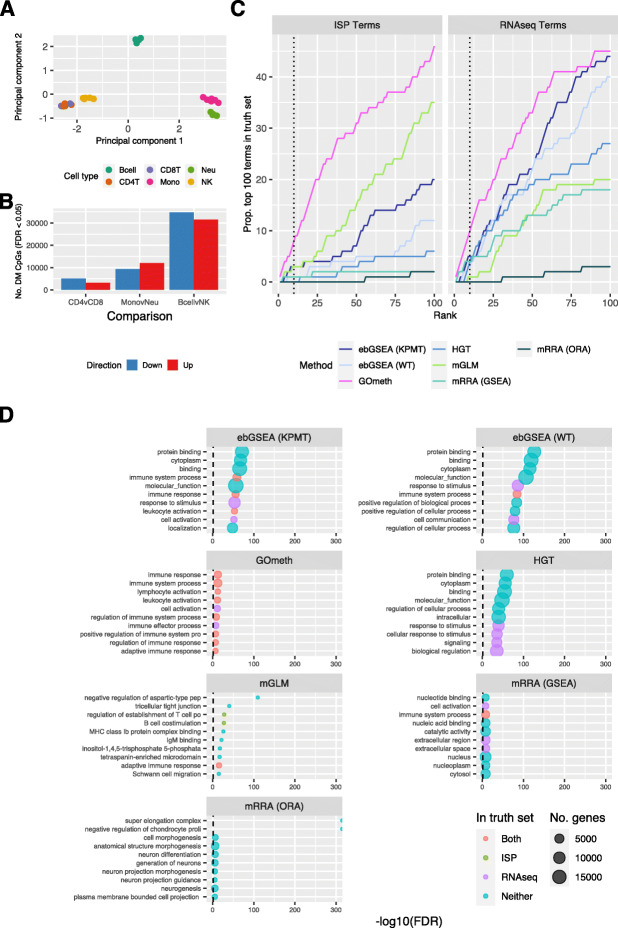
Fig. 4.
Comparison of gene set testing performance on Gene Ontology (GO) categories. A Multidimensional scaling plot of EPIC array sorted blood cell data. B Numbers of differentially methylated CpGs with an adjusted p value < 0.05, for each cell type comparison: CD4 T cells vs. CD8 T cells, monocytes vs. neutrophils and B cells vs. NK cells. The blue bar is the number of significant CpGs that are less methylated in the first cell type relative to the second, and the red bar is the number that are more methylated; e.g., ~5000 CpGs are less methylated and ~3000 are more methylated in CD4 T cells, compared to CD8 T cells. C Cumulative number of GO terms, as ranked by various methods, that are present in each truth set for the B cells vs. NK comparison. ISP Terms = immune-system process child terms truth set; RNAseq Terms = top 100 terms from RNAseq analysis of the same cell types. D Bubble plots of the top 10 GO terms as ranked by various gene set testing methods. The size of the bubble indicates the relative number of genes in the set. The color of the bubble indicates whether the term is present in either RNAseq (purple) or ISP (green) truth sets, both (red) or neither (blue). ebGSEA (KPMT) = ebGSEA using Known Population Median Test; ebGSEA (WT) = ebGSEA using Wilcoxon Test; GOmeth = GOmeth using either FDR < 0.05 (for contrasts with <5000 significant CpGs) or top 5000 most significant probes; HGT = hypergeometric test; mGLM = methylglm; mRRA (GSEA) = methylRRA using gene set enrichment analysis; mRRA (ORA) = methylRRA using over-representation analysis

