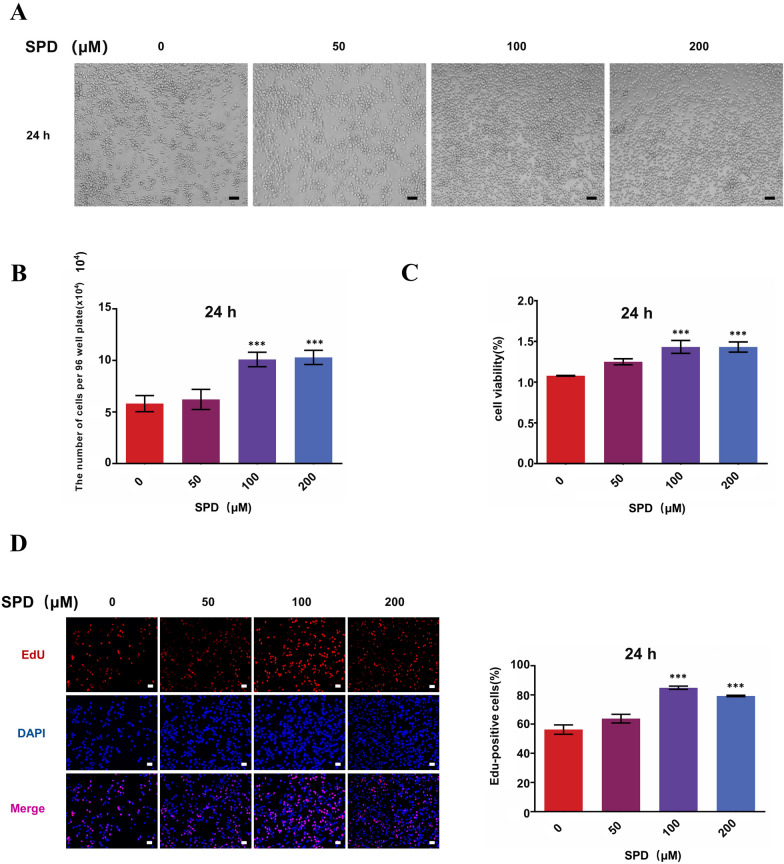
Fig. 2.
SPD enhances viability and increases the number of FGSCs. A Cellular morphology of FGSCs treated with various concentrations (0, 50, 100, and 200 μM) of SPD at 24 h (scale bars: 20 µm). B The amount of FGSCs treated with various concentrations of SPD. C Graphic representation of results from CCK-8 assays to determine cell viability of FGSCs treated with different concentrations of SPD for 24 h. Data points are the percentage (%; optical density at 450 nm, treated/optical density at 450 nm, untreated) relative to untreated cells at that time point. D Proliferation of FGSCs treated by SPD at 24 h was determined using 5-ethynyl-2ʹ-deoxyuridine staining (scale bars: 20 μm). Proliferation was significantly increased from the 100 μM SPD-treated groups. All data are expressed as the mean ± SEM of values from experiments performed at least in triplicate. ***P < 0.001 compared with controls

