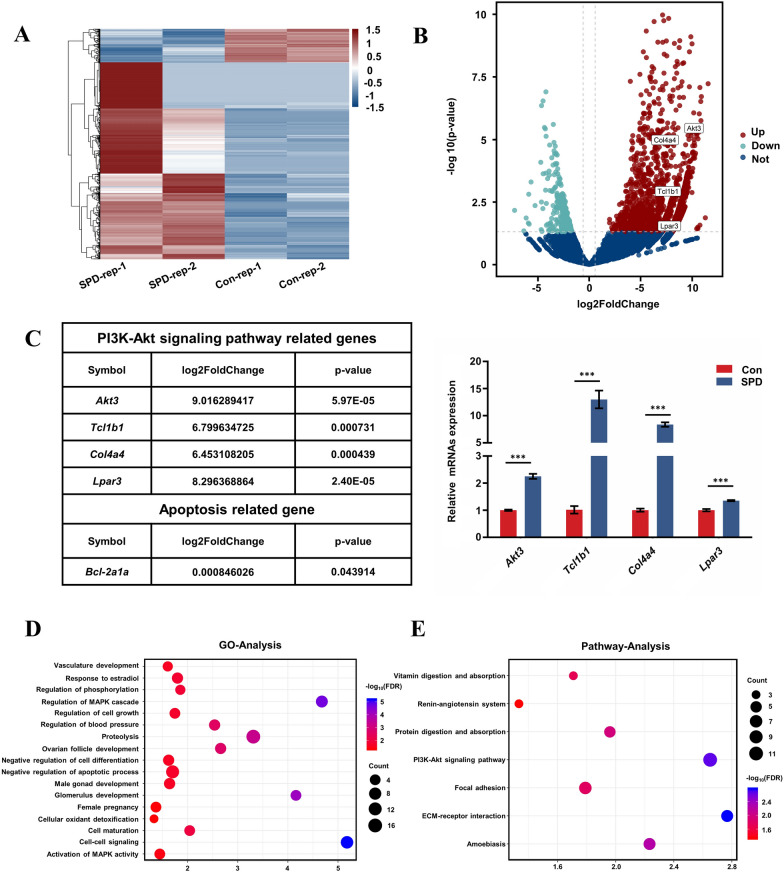
Fig. 5.
SPD changes expression of autophagy-related genes and pathways in FGSCs. A Hierarchical clustering shows differentially expressed mRNA patterns between the control and SPD-treated groups. B Volcano plot of differentially expressed mRNAs. C Differentially expressed mRNAs are related to genes involved in the PI3K/AKT pathway. The qRT-PCR results are consistent with changes in the transcriptome profile (P < 0.05). ***P < 0.001 compared with controls. Note that one of the differentially expressed mRNAs is Bcl-2, which can inhibit cell death. D GO analysis of RNA-seq data. The top 17 significantly enriched biological processes are shown. E KEGG pathway analysis of RNA-seq data. The top seven enriched pathways are shown. Con control

