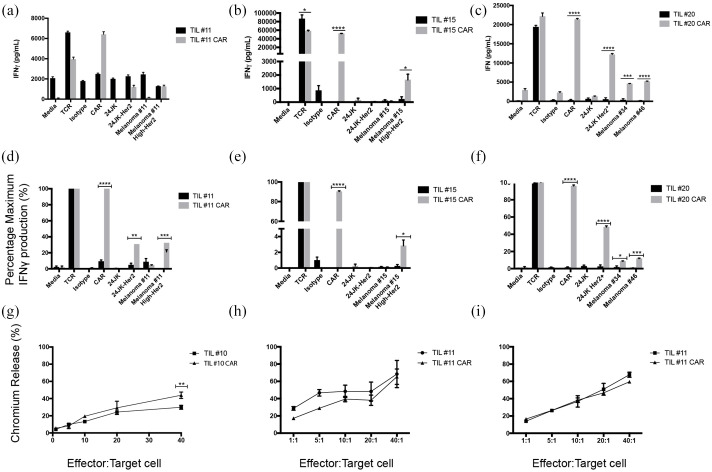
Figure 6.
TILs transduced with anti-Her2 CAR respond against autologous melanoma tumor cell lines.
(a)–(f) IFNγ production of TILs transduced with anti-Her2 CAR compared with non-transduced TILs. (a)–(c) Raw data values. (a) TIL#11 co-cultured with a panel of targets, including both parental (Melanoma#11) and high expressing Her2 tumor lines (Melanoma#11 High Her2); (b) TIL#15 co-cultured with a panel of targets, including parental (Melanoma#15) and high expressing Her2 tumor lines (Melanoma#15 High-Her2); (c) TIL#20 co-cultured with a panel of targets, including HLA matched melanoma tumor lines. Data are presented as mean ± SEM performed in triplicate. (d)–(f) Normalized values of data from panels (a)–(c); we defined T-cell responses to CD3 ligation as “maximal” (100%) and presented responses to other stimuli as a proportion of maximum. (g)–(i) Cytotoxic activity measured using 51Cr release assay. (g) TIL#10 transduced with anti-Her2 CAR were compared with TILs transduced with an empty viral vector control against autologous tumor cell targets. (h) TIL#11 (TIL-CAR versus TIL) compared against parental tumor cell line (mean Her2 antigen expression 11%) and (i) TIL#11 against autologous tumor lines transduced for high expression of Her2 antigen (mean Her2 antigen expression 98%).
Statistical significance was determined using unpaired Student’s t-test of triplicate wells from a single experiment (*p ⩽ 0.05, **p ⩽ 0.01, ***p ⩽ 0.001, ****p ⩽ 0.0001).
CAR, chimeric antigen receptor; TIL, tumor-infiltrating lymphocyte; TCR, transgenic T-cell receptor

