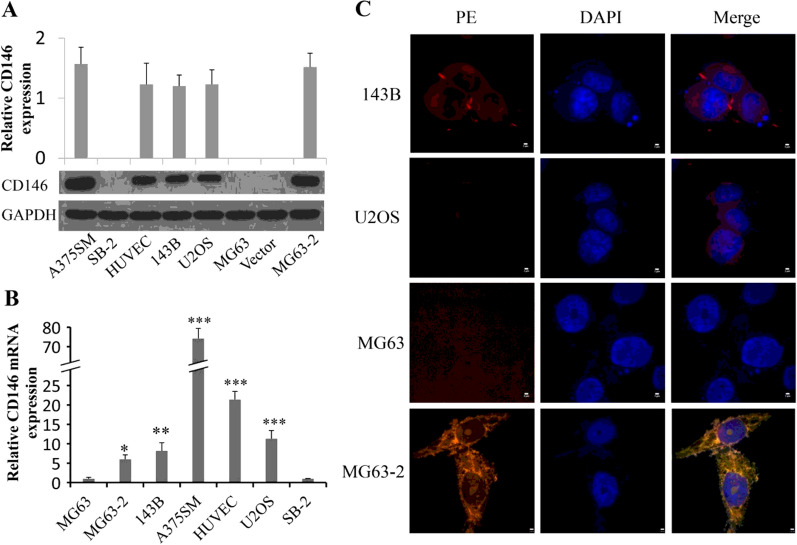
Fig. 1.
CD146 expression on human OS cells. The expression levels of CD146 were determined by Western blotting (A) or qPCR (B), and GAPDH served as an internal control. The A375SM and HUVEC were used as positive controls, and SB-2 as a negative control. For mRNA, CD146 was normalized to GAPDH first, and expression levels were compared to that of MG63 (set as 1). C Double-staining immunofluorescence and confocal microscopy analysis of CD146 expression and distribution in human osteosarcoma cells. The merged figures were the overlapping of red (CD146) and blue (nucleus) signals. The merged colour in MG63-2 was partially affected by the vector pwpxl-GFP (green, Additional file 1: Fig. S3C). Scale bar, 2 μm. *P < 0.05; **P < 0.01; ***P < 0.001

