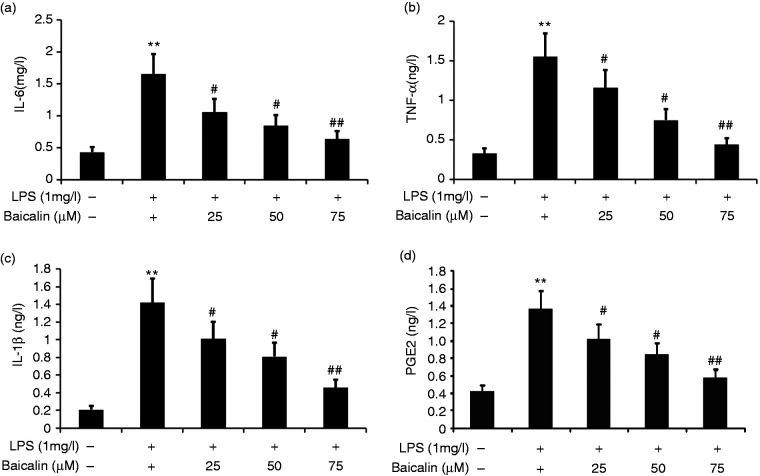
Figure 9.
Effect of baicalin on LPS-induced A549 cell inflammation. A549 cells were incubated with LPS (1.0 mg/l) and various concentrations of baicalin (25, 50, and 75 μM) for 24 h. IL-6, IL-1β, PGE2, and TNF-α in A549 cells were measured by ELISA. The data from three independent experiments is presented as the mean ± SD. **P < 0.01 versus the control group. #P < 0.05; ##P <0.01 versus only LPS group. P < 0.05 versus the baicalin (25 μM) group versus the baicalin (50 μM) group and the baicalin (75 μM) group. P > 0.05, the baicalin (50 μM) group versus the baicalin (75 μM) group.

