Figure 2.

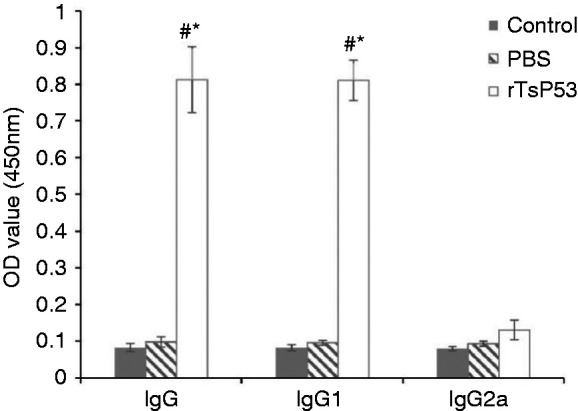
Ab isotype profiles of rTsP53. Results expressed as the means ± SEM. *P < 0.05 vs. control group and #P < 0.05 vs. PBS group.

Ab isotype profiles of rTsP53. Results expressed as the means ± SEM. *P < 0.05 vs. control group and #P < 0.05 vs. PBS group.