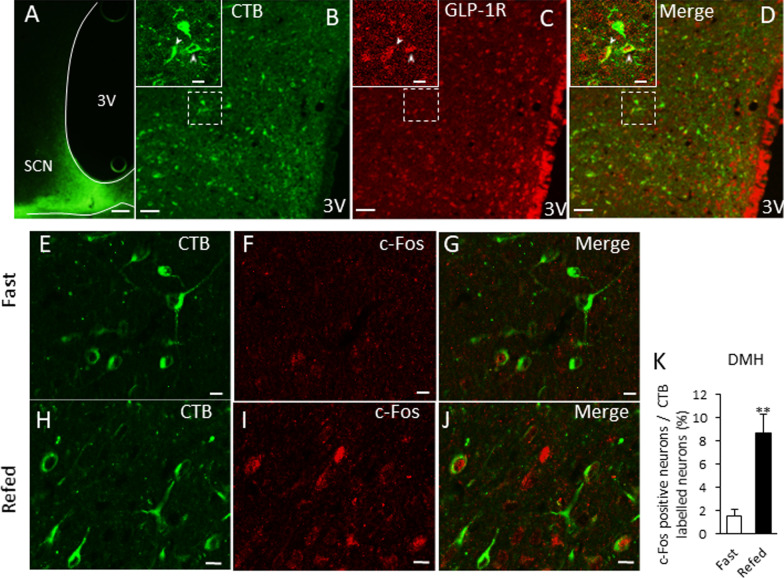
Fig. 3.
SCN projecting DMH neurons with GLP-1R expression increase c-Fos after feeding. A The injection site of the retrograde tracer, CTB in the SCN. Scale bar = 100 μm. B The distribution of CTB-positive neurons in the DMH. C The distribution of GLP-1R-positive neurons in the DMH. D A merged image of B and C. Scale bars = 50 μm. The enlarged images located in the left corner in the image of B–D indicate the image in the dotted white square in the respective image. Scale bars = 10 μm. Arrowheads indicate the neurons co-localizing CTB and GLP-1R. E–J: The distribution of CTB-positive neurons (E, H), c-Fos-positive neurons (F, I) and a merged image (G, J) in the DMH of a control fasting (E–G) or refeeding (H–J) rat. Scale bars in E–J indicate 10 μm. K The percentage of c-Fos-positive neurons among CTB-positive neurons in the DMH. (n = 5, 4) ** P < 0.01, Student t-test

