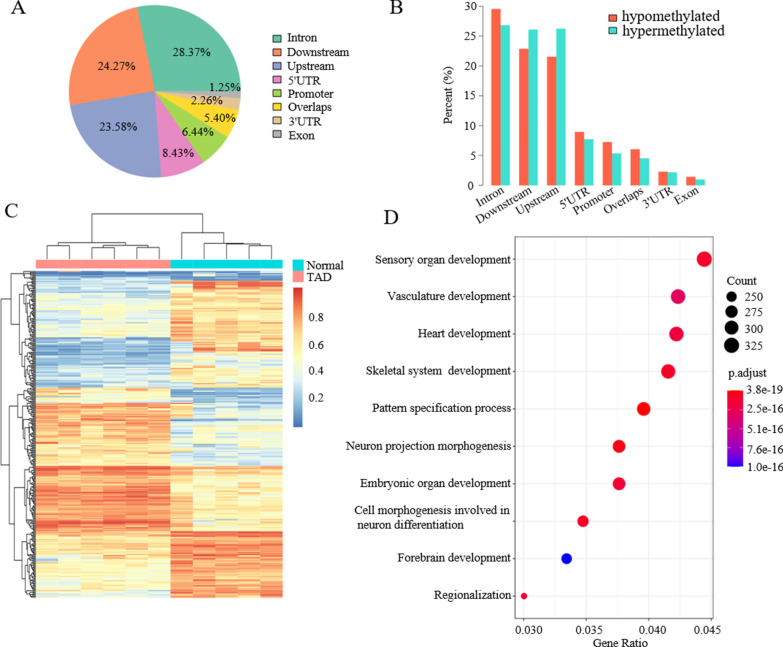
Fig. 1.
DNA methylation differences between TAD and healthy control samples. a DMR percentages in different genomic components (promoters were defined as 1–2,500 bp upstream of transcription start site, alternative promoters were not included.). b Hypermethylated and hypomethylated DMR percentages in different genomic components. c Supervised clustering with the top 300 DMRs (detail information was showed in Additional file 2: Table S3). d Gene ontology (GO) enrichment analysis with a focus on biological processes for the hypomethylated DMRs

