Fig. 5.

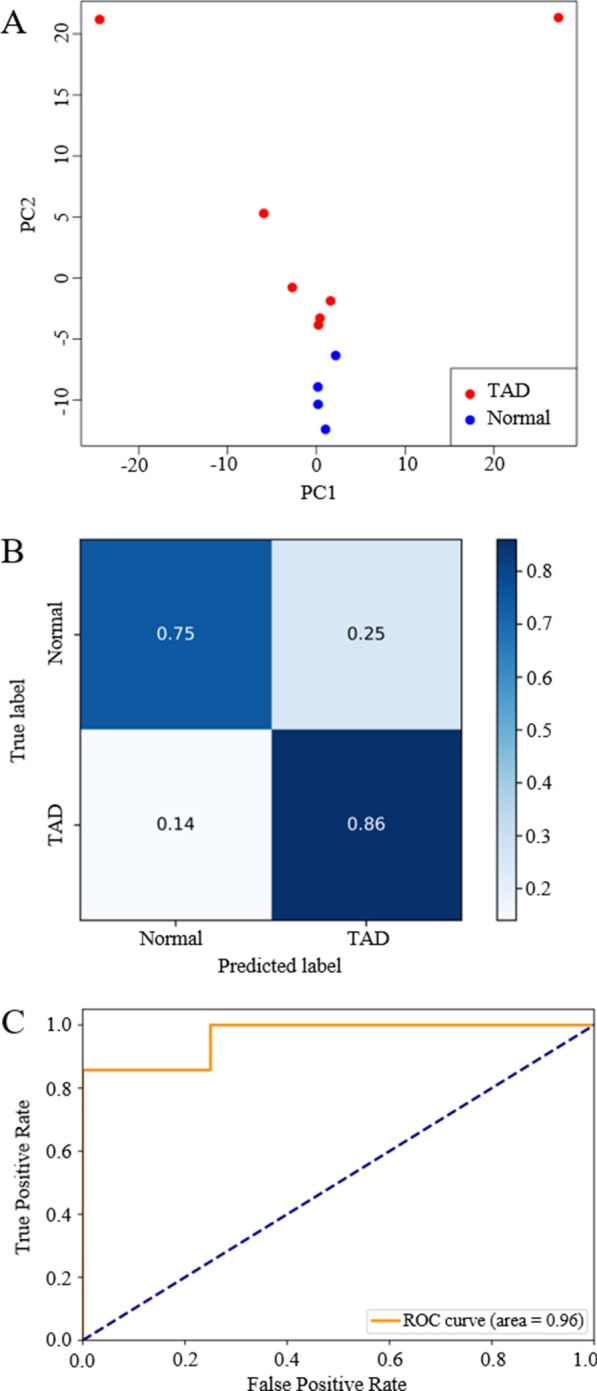
Methylation signatures from cfDNA as a biomarker for TAD diagnosis. a Principal component analysis of cfDNA methylation data on tDMRs (red dots indicate TAD patient and blue indicate healthy people, P value = 0.037 from PERMANOVA analysis). The top 50 DMRs with the largest cfDNA methylation variance contributing to the top two principal components were selected for model training. Optimized random-forest model was evaluated with LOOCV, and the confusion matrix (b) and the ROC curve (c) were plotted to assess the performance of the model (AUC = 0.96). Sensitivity: 86%, specificity: 75%. (LOOCV: leave-one-out cross validation, ROC: Receiver operating characteristic, AUC: area under curve)
