Fig. 3.
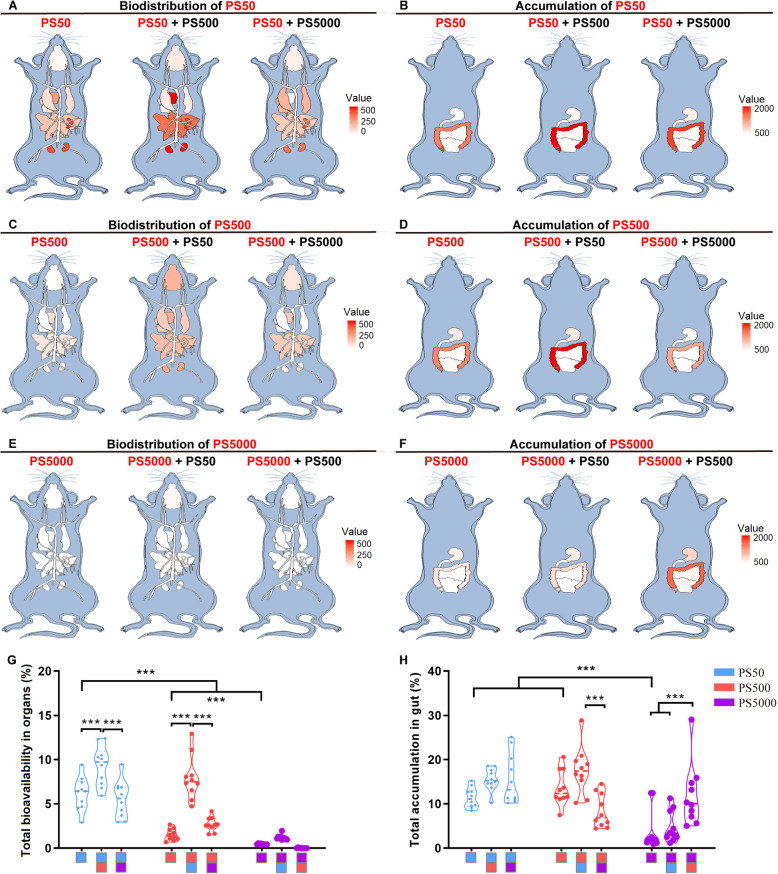
Biodistribution of PS50, PS500 and PS5000 in the mice after 24 h exposure. Summarize diagrams showed the A) organ biodistribution and B) intestinal accumulation of PS50 after a single exposure of PS50 or co-exposure with PS500 or PS5000 for 24 h. Summarize diagrams showed the C) organ biodistribution and D) intestinal accumulation of PS500 after a single exposure of PS500 or co-exposure with PS50 or PS5000 for 24 h. Summarize diagrams showed the E) organ biodistribution and F) intestinal accumulation of PS5000 after a single exposure of PS5000 or co-exposure with PS50 or PS500 for 24 h. G Total bioavailability of PS particles. H Total accumulation of PS particles in the intestine. ***P < 0.001, comparisons were made with ANOVA, followed by Tukey’s method (n = 10 per group). The color bars were used for grouping, one bar represented a dose of 250 mg/kg body weight, and two bars with different color represented a mix exposure with a dose of 250 mg/kg body weight of each particle

