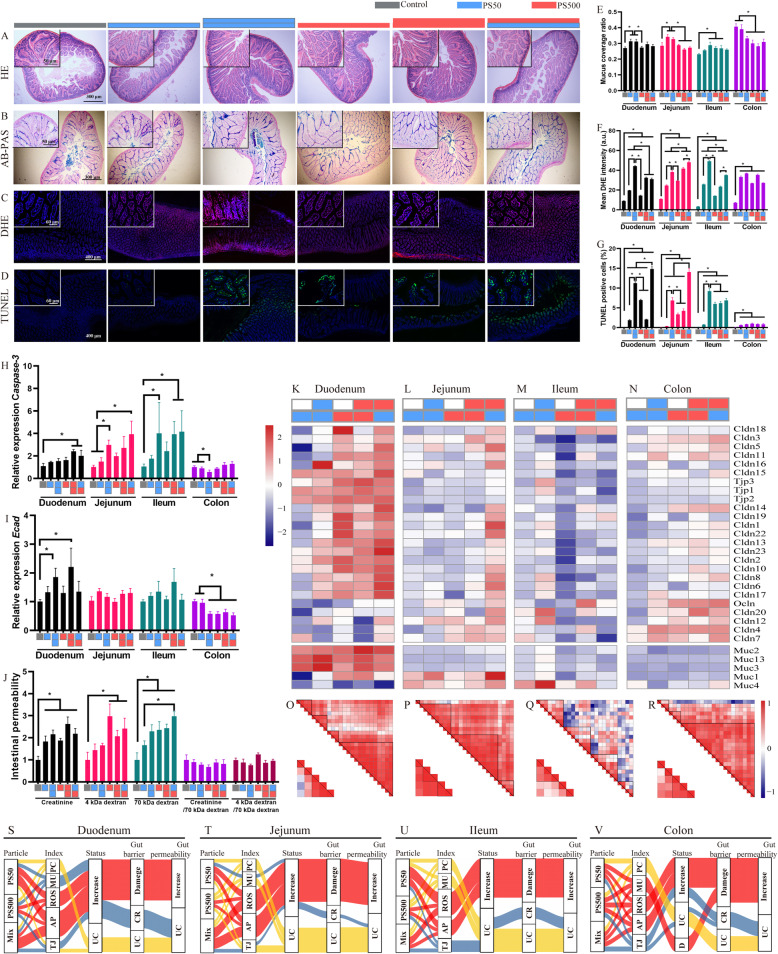
Fig. 5.
Mixture of PS micro- and nanoplastics aggravated dysfunction of intestinal barrier in mice. Representative merged images of the jejunum sections A) stained with H&E to assess the pathological changes; B stained with AB-PAS to assess the change of mucin secretion, the mucin was stained in blue; C stained with DHE to assess the ROS generation, the ROS was stained in red and the nucleus was stained with DAPI in blue; D stained with TUNEL to assess cell apoptosis, the apoptosis cells were stained in green and the nucleus was stained with DAPI in blue. The quantification of E) mucus coverage ratio, F) mean DHE intensity and G) TUNEL positive cell rate in the four intestinal segments. The mRNA expression of H) Casepase-3 and I) Ecad in the four intestinal segments were shown. J The fluxes of creatinine, 4 kDa dextran, 70 kDa dextran in the intestine were quantified. The mRNA expressions of TJPs and mucins genes were shown in the K) duodenum, L) jejunum, M) ileum and N) colon. The correlation of TJPs genes expression and mucins genes expression in the O) duodenum, P) jejunum, Q) ileum and R) colon. Sankey diagrams summarized multiple effects of PS particles in the S) duodenum, T) jejunum, U) ileum and V) colon. *P < 0.05. Results are shown as means ± SE. Comparisons were made with ANOVA, followed by Tukey’s method (n = 5 per group). The color bars were used for grouping, one bar represented a dose of 250 mg/kg body weight, two bars with same color represented a dose of 500 mg/kg body weight, and two bars with different colors represented the mix exposure group with a dose of 250 mg/kg body weight of each particle. PC, pathological change; MU, mucin secretion; AP, apoptosis; TJ, tight junction; UC, unchanged; CR, compensatory response

