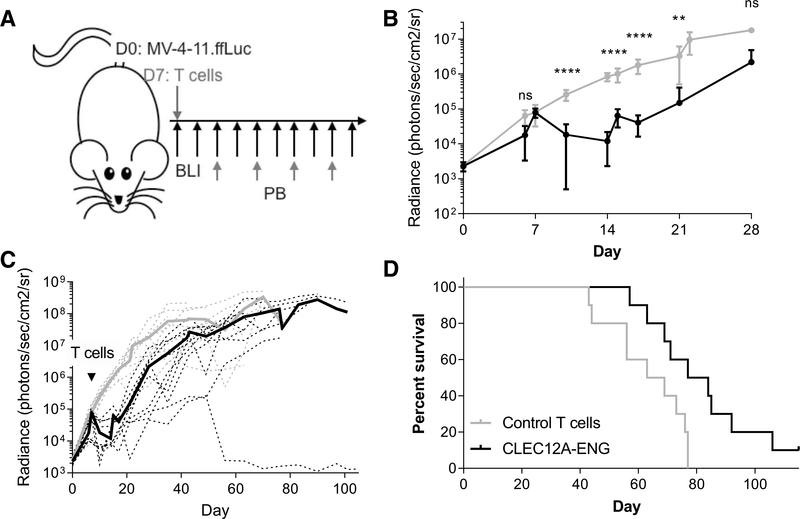
Figure 2.
CLEC12A-ENG T cells exhibit antitumor efficacy in vivo. A, Schematic of MV-4–11 Xenograft model. NSG mice were engrafted with 1e6 MV-4–11.ffLuc i.v. on day 0. On day 7,10e6 T cells (control or CLEC12A-ENG) were administered. Leukemia was followed with BLI and T cells tracked in peripheral blood every 2 weeks beginning on day 21. B and C, Quantitation of sequential BLI of mice (n = 5 mice per group per experiment, two independent experiments, with a different T-cell donor for each experiment). B, Leukemia burden over first 28 days between control (gray line) and CLEG2A-ENG-treated (black line) mice. ****, P< 0.001; **, P< 0.01. C, Extended BLI data from B. Dashed lines represent each individual mouse, solid lines are average BLI of group. Gray lines, control mice; black lines, treated mice.D, Kaplan-Meier survival analysis, median survival: control T cells, 66 days; CLEC12A-ENG T cells, 80.5 days (P = 0.01).

