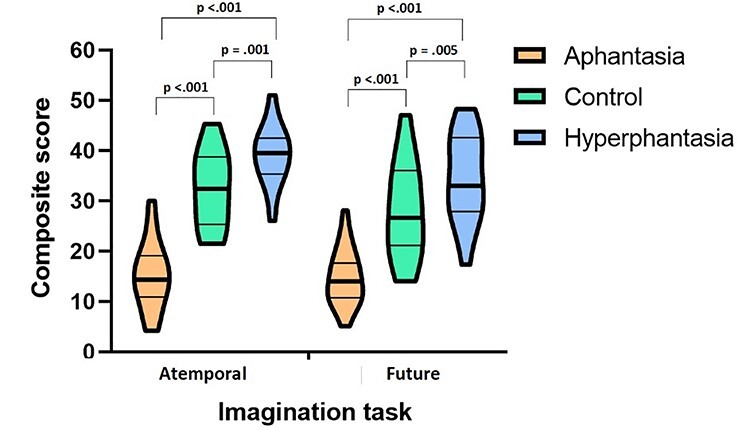
Figure 1.

Mean composite score (maximum = 54) for each group in the atemporal and future imagination tasks. The thick line within the violin plots display the median score, the thinner lines reflect the 25th and 75th percentiles. The top and bottom of the violin plots illustrate the lowest and highest scores in the sample. The plots were created using Prism GraphPad Prism v. 9 (https://www.graphpad.com/scientific-software/prism/).
