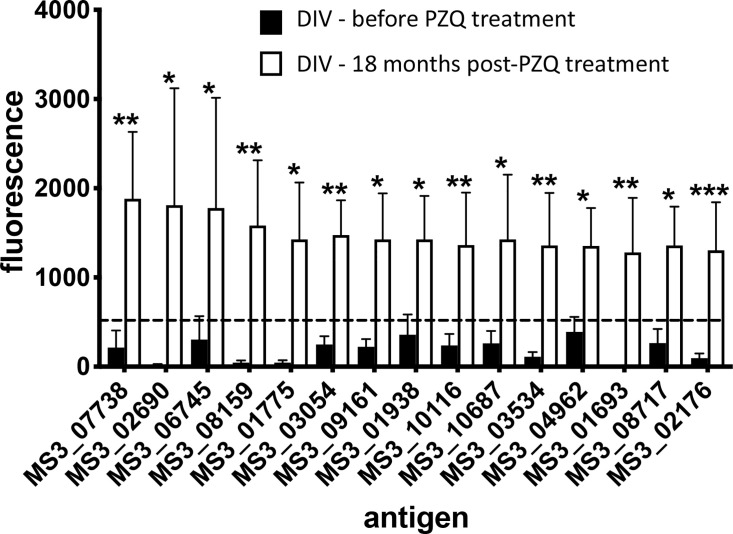
Figure 3.
Antibody signatures to arrayed antigens differ in S. haematobium-infected subjects before and after PZQ treatment. Graph showing antigens which are targets of the top 15 significant (sorted by signal intensity) IgG responses in the DIV cohort before and after PZQ treatment. The dashed line represents the reactivity cut-off, determined as the mean SI + 1.5SD of the IgG response to all negative control (empty vector) spots. Significance was determined using a Mann-Whitney test. *P ≤ 0.05, **P ≤ 0.01, ***P ≤ 0.001.

