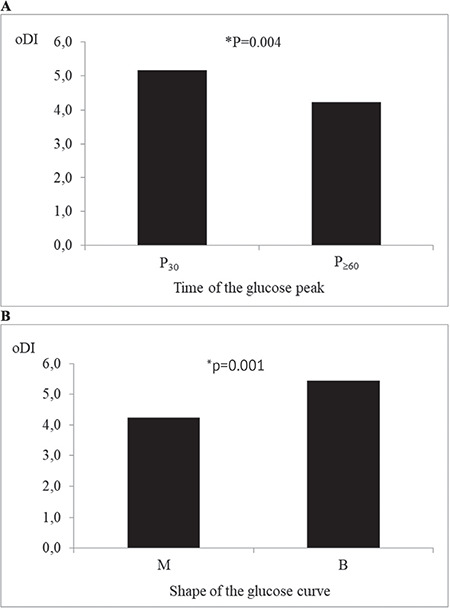
Figure 1.

Comparison of average oral disposition index in groups with: (A) early vs late glucose peak; (B) monophasic vs biphasic glucose curve
*After adjustment for age, sex, puberty stage and body mass index z-score.
oDI: oral disposition index, P30: glucose peak at 30 mintues, P≥60: glucose peak at ≥60 minutes, M: monophasic glucose curve, B: biphasic glucose curve
