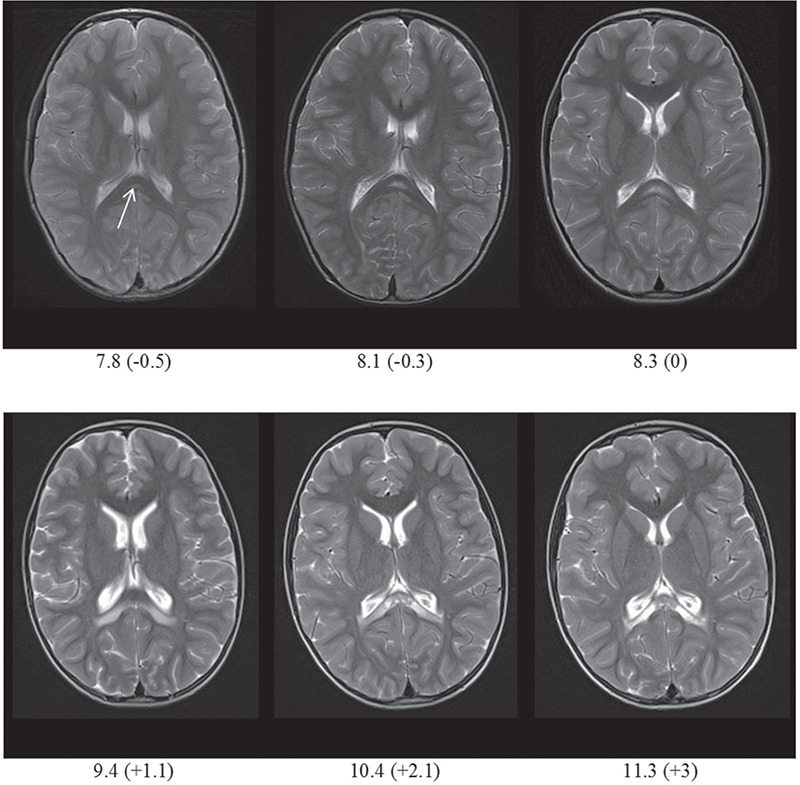
Figure 1.

Brain magnetic resonance imaging, T2-weighted axial images. Top row: pre-transplant, bottom row post-transplant. Interval of scan in years (years before [-] or after [+] transplant). Arrow indicates increased signal lesion in splenium of corpus callosum that progressively enlarged pre-transplant, further progressed at 1.1 years post-transplant, but subsequent stabilisation
