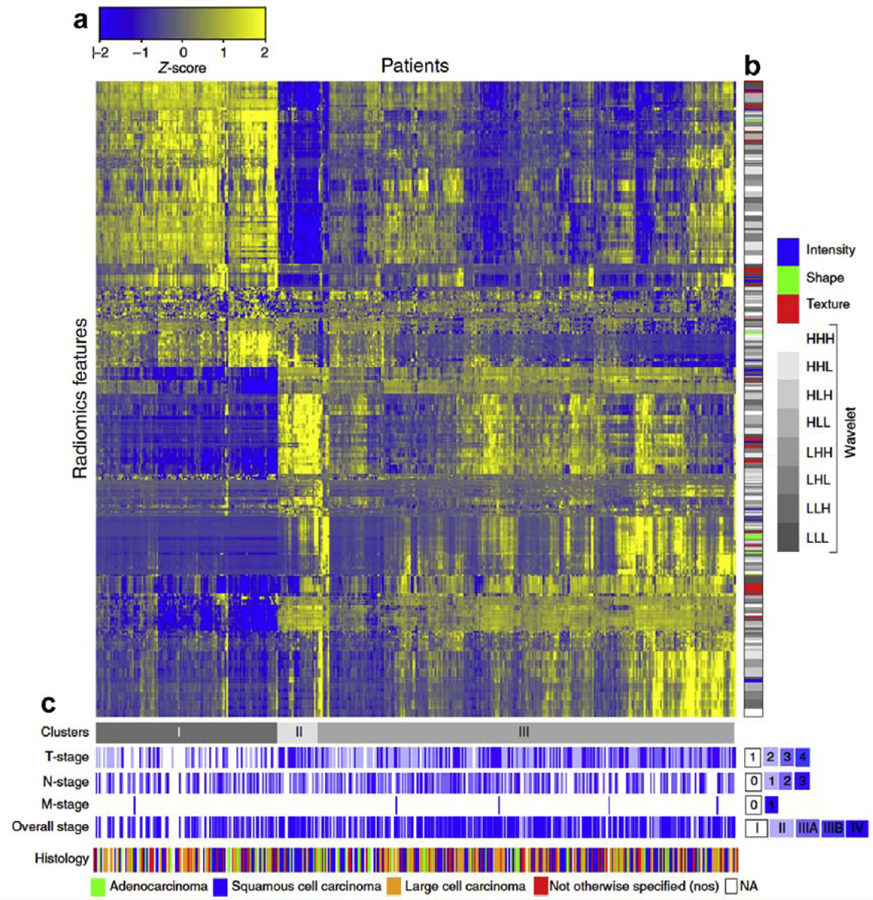
Figure 4:

Heat map that includes the process of data integration and clustering generated in a study conducted by Alerts H. and coworkers, entitled “Decoding tumor phenotype by noninvasive imaging using a quantitative radiomics approach” [94]. It is possible to identify some elements in the image such as: (a) direct association between the patients enrolled and the radiomics feature expressions (indicating similarity through a scale of scores), (b) clinical parameters of the patients associated with the different radiomics feature expressions and, (c) classification of patients according to different stages of the assessed disease.
