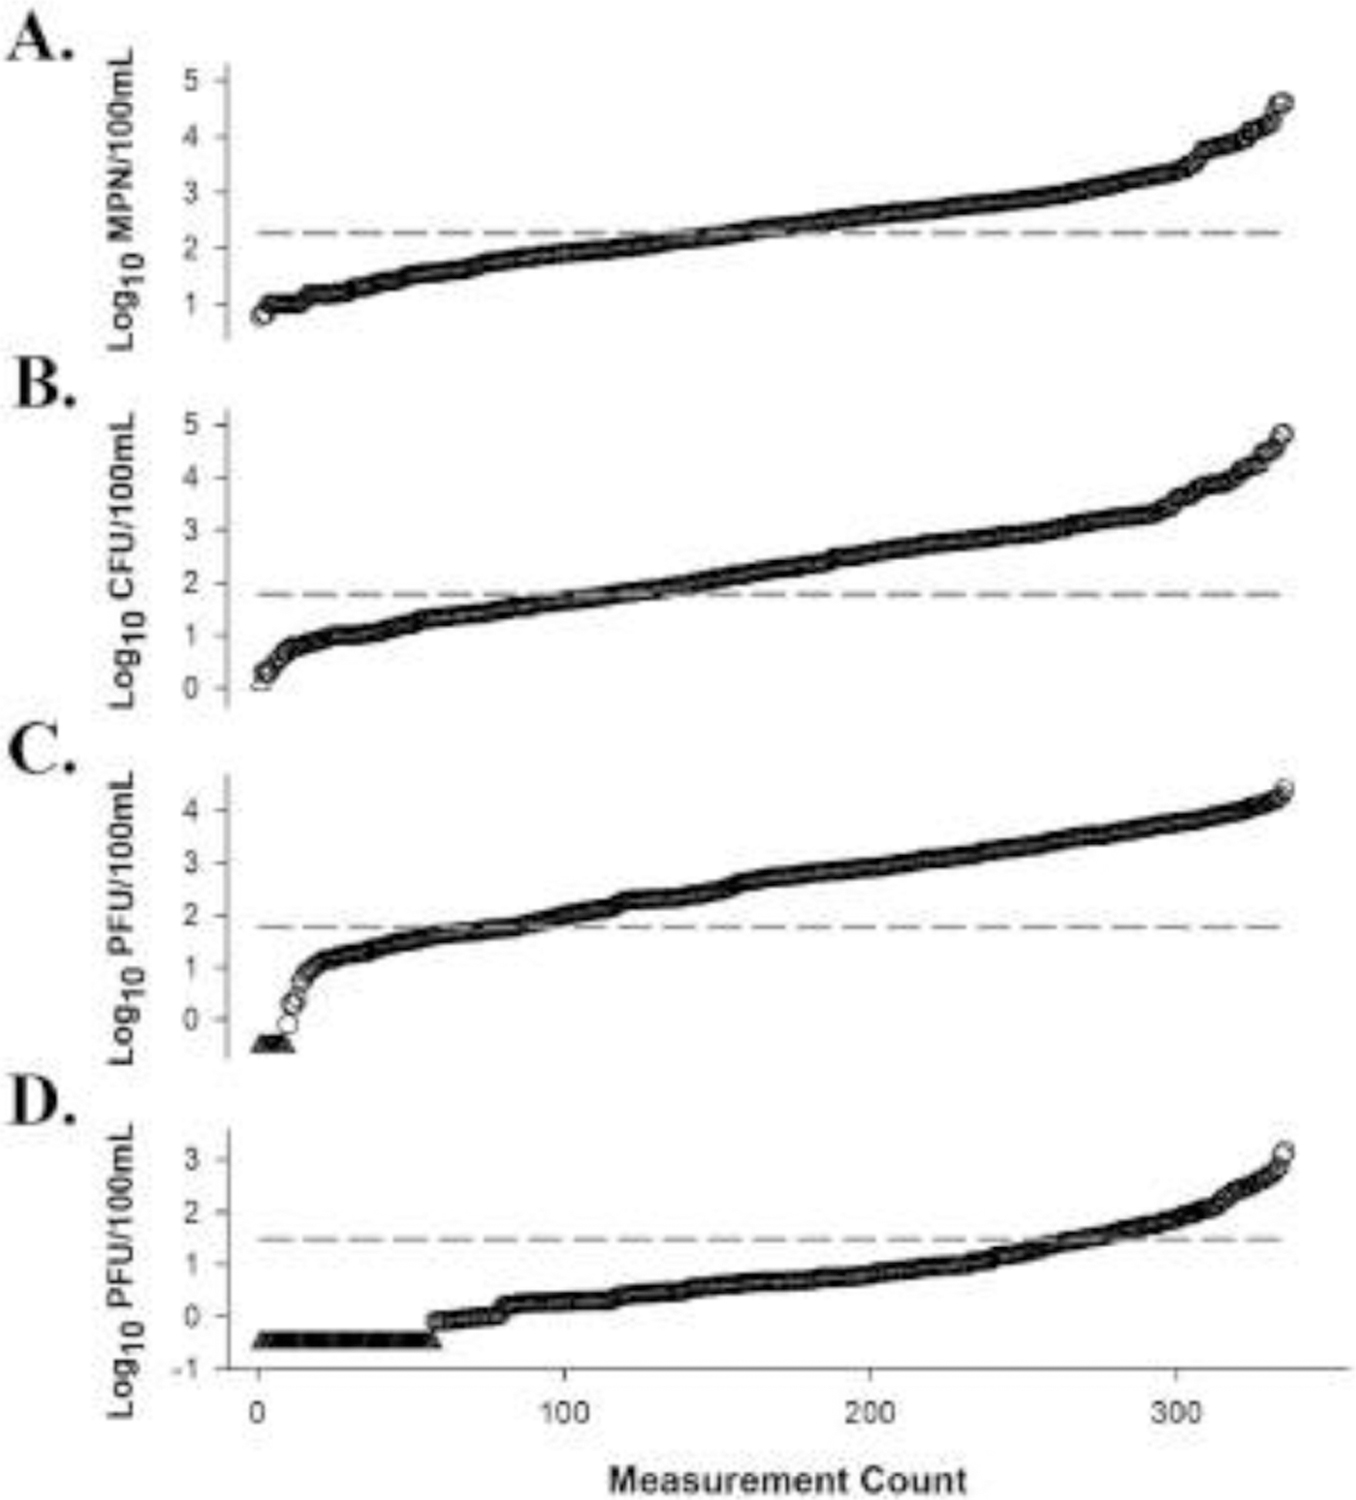
Fig. 1.

General fecal indicator measurements (n = 365) for E. coli (Panel A), enterococci (Panel B), somatic coliphage (Panel C), and F+ coliphage (Panel D) ranked from lowest to highest quantities (values increase from left to right) (Wanjugi et al. 2018). Data indicated by a triangle denotes a non-detect, while data denoted by circles represents a general fecal indicator measurement. The dashed line represents general fecal indicator data grouping thresholds used in this study for E. coli (190 most probable number (MPN)/100mL), enterococci (60 culture forming unit (CFU)/100mL), somatic coliphage (60 plaque forming unit (PFU)/100mL), and F+ coliphage (30 PFU/100mL).
