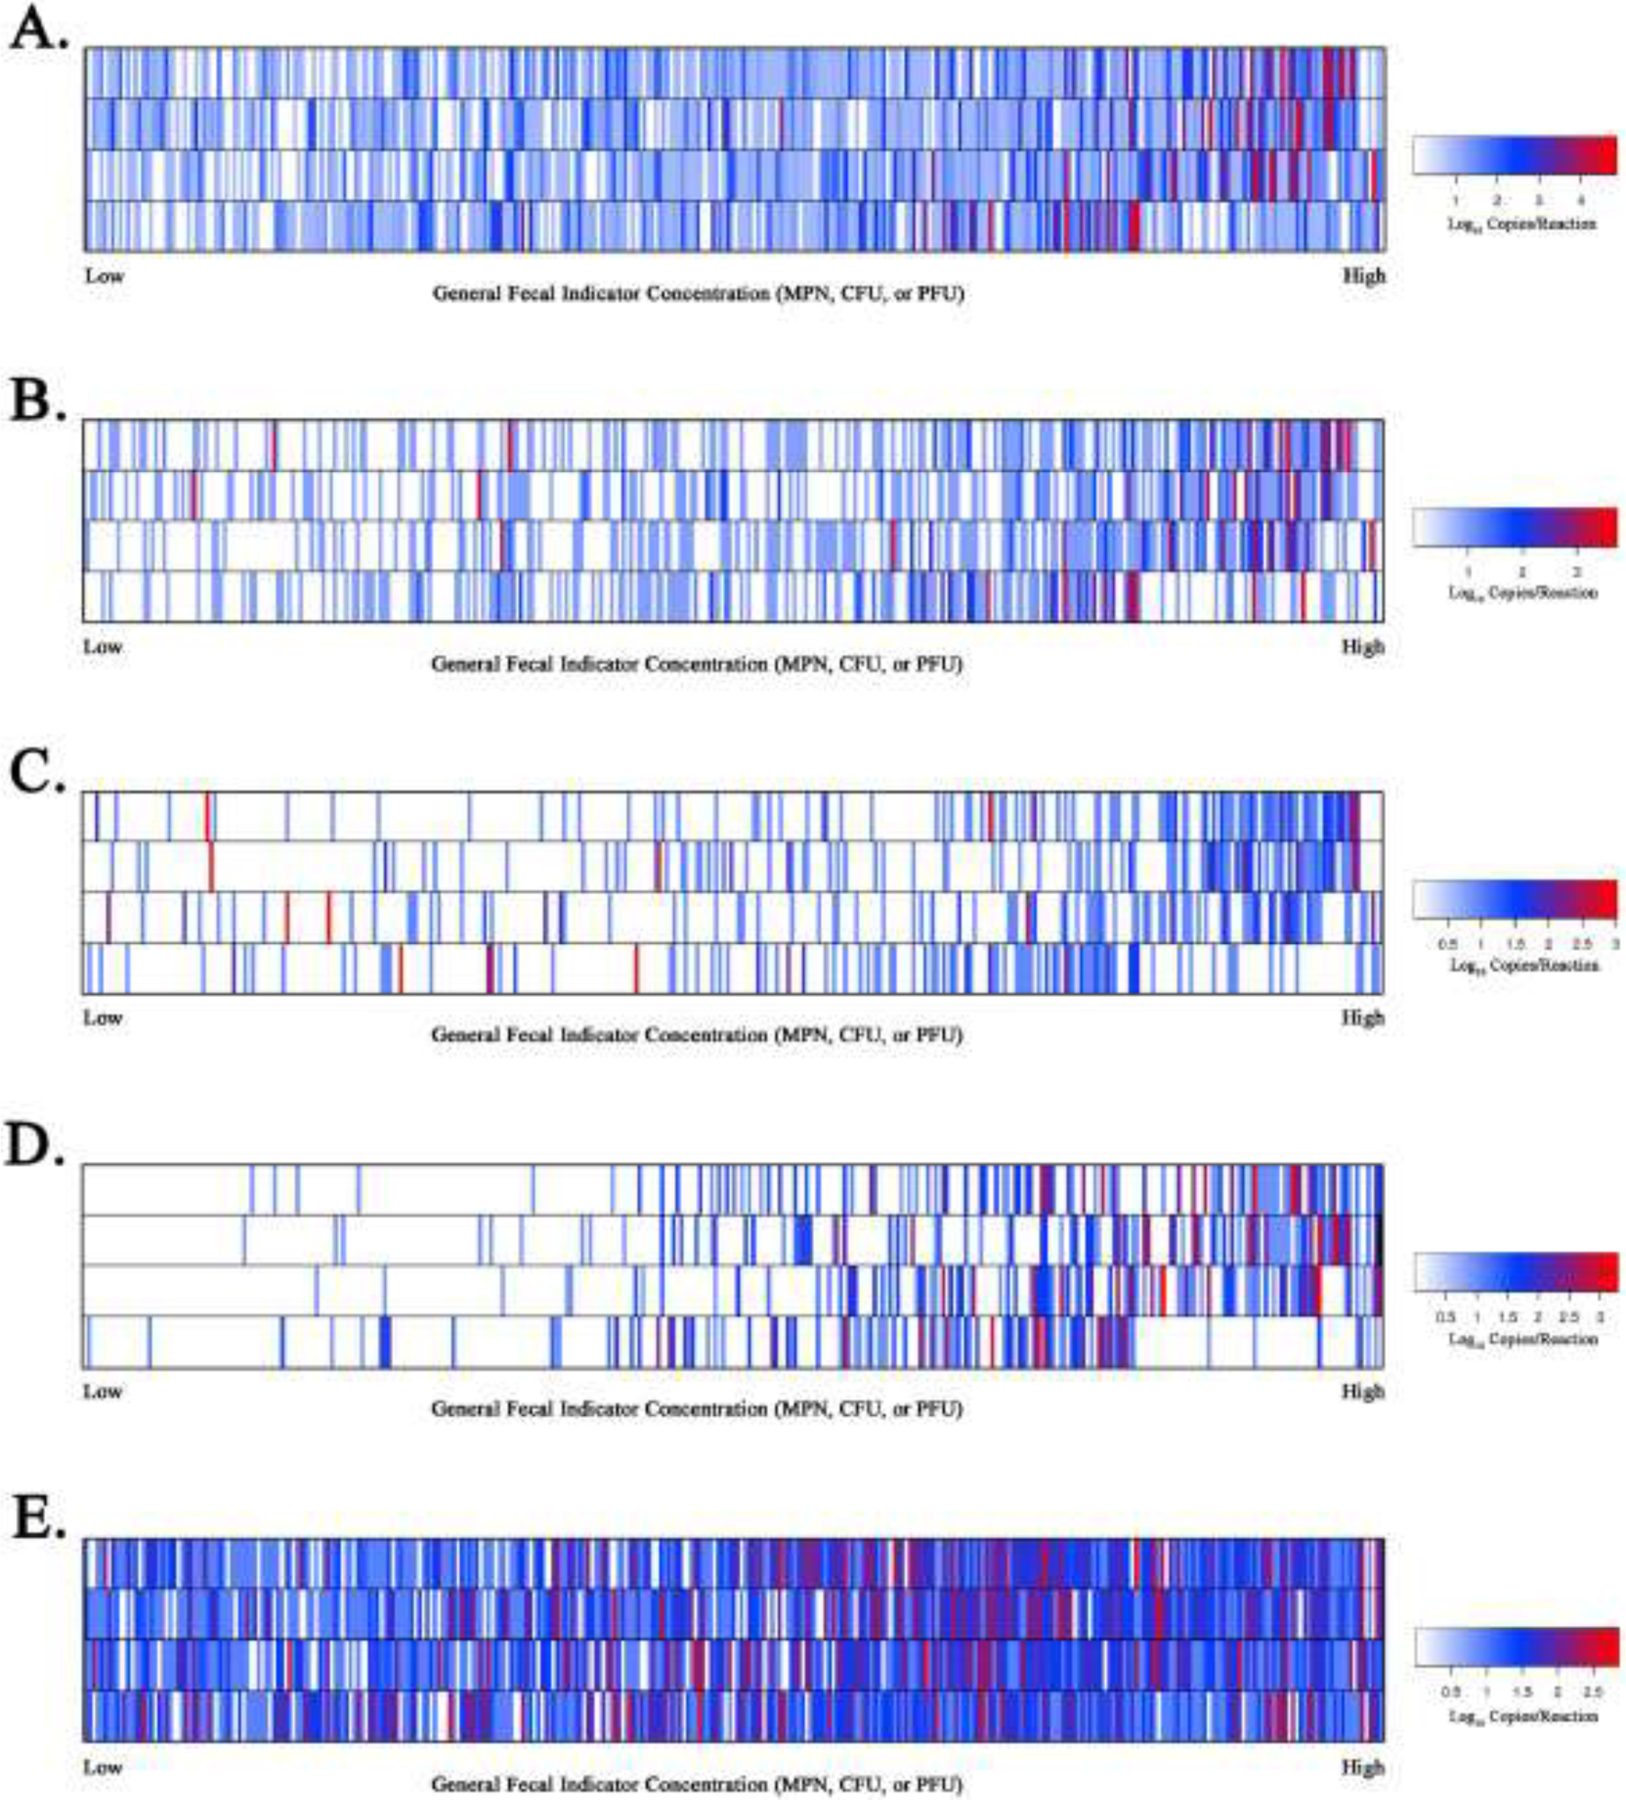
Fig. 2.

Heat map illustrating measurements of host-associated qPCR genetic marker estimated log10 copies per reaction concentrations for HF183/BacR287 (Panel A), HumM2 (Panel B), DG3 (Panel C), Rum2Bac (Panel D), and GFD (Panel E). Individual water sample estimated log10 copy per reactions concentrations for respective qPCR assays are ranked from lowest to highest (x-axis) based on four different general fecal indicator definitions (y-axis) including, situated from top to bottom, E. coli MPN/100mL, enterococci CFU/100mL, somatic coliphage PFU/100mL, and F+ coliphage PFU/100mL. Heat map keys are shown for each qPCR assay data set reporting estimated log10 copies per reaction color coding information.
