Fig. 3.

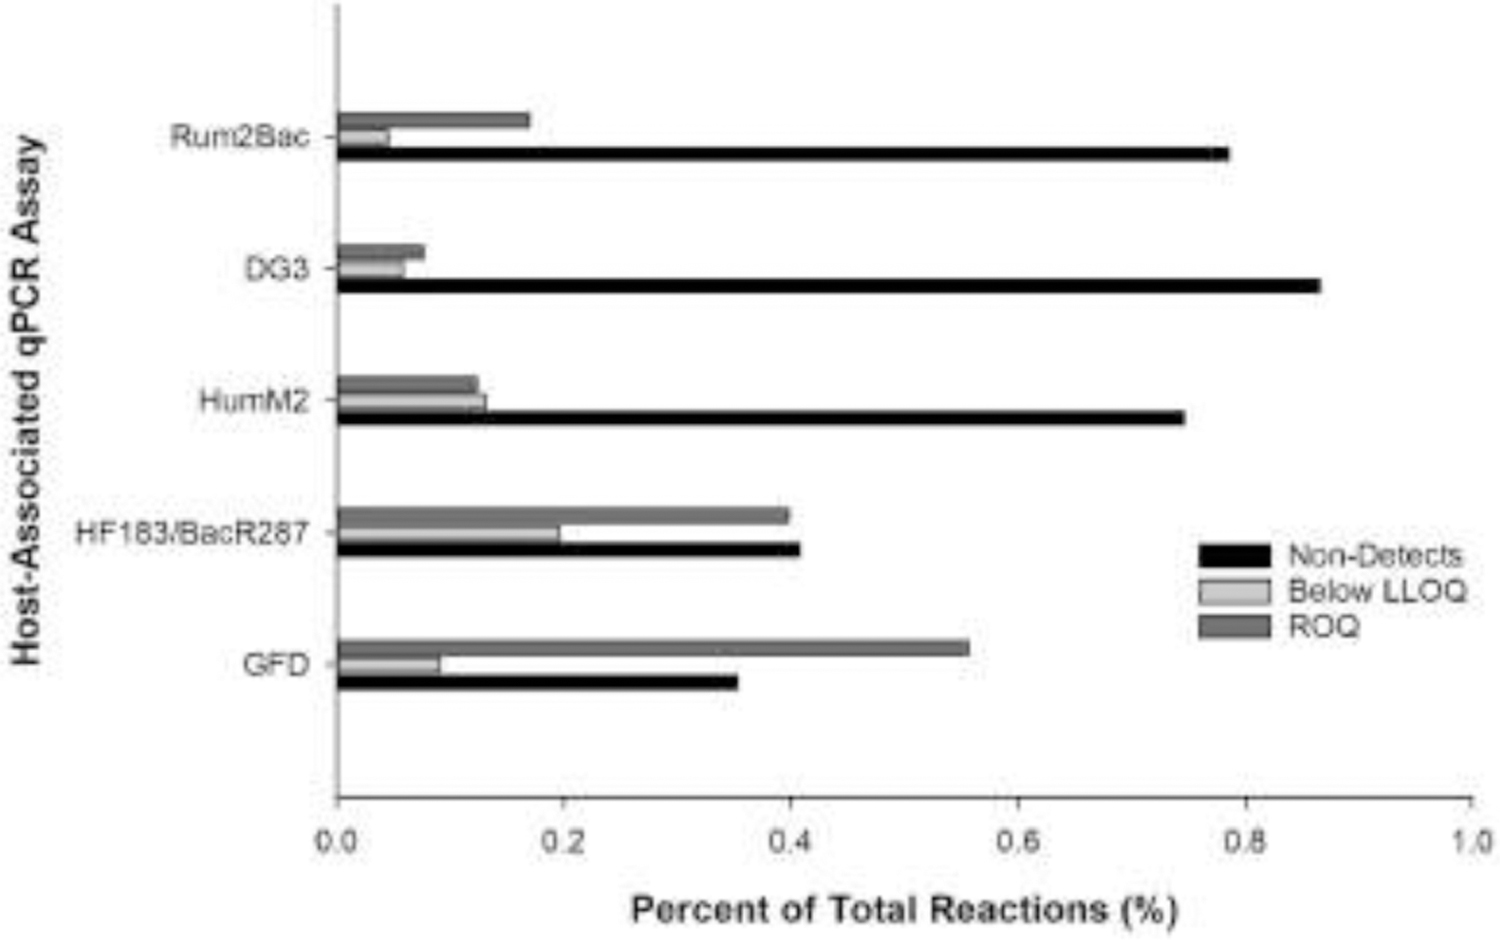
Histogram showing proportion of non-detections, detections below the lower limit of quantification (LLOQ), and measurements within the range of quantification (ROQ) for each host-associated qPCR assay.

Histogram showing proportion of non-detections, detections below the lower limit of quantification (LLOQ), and measurements within the range of quantification (ROQ) for each host-associated qPCR assay.