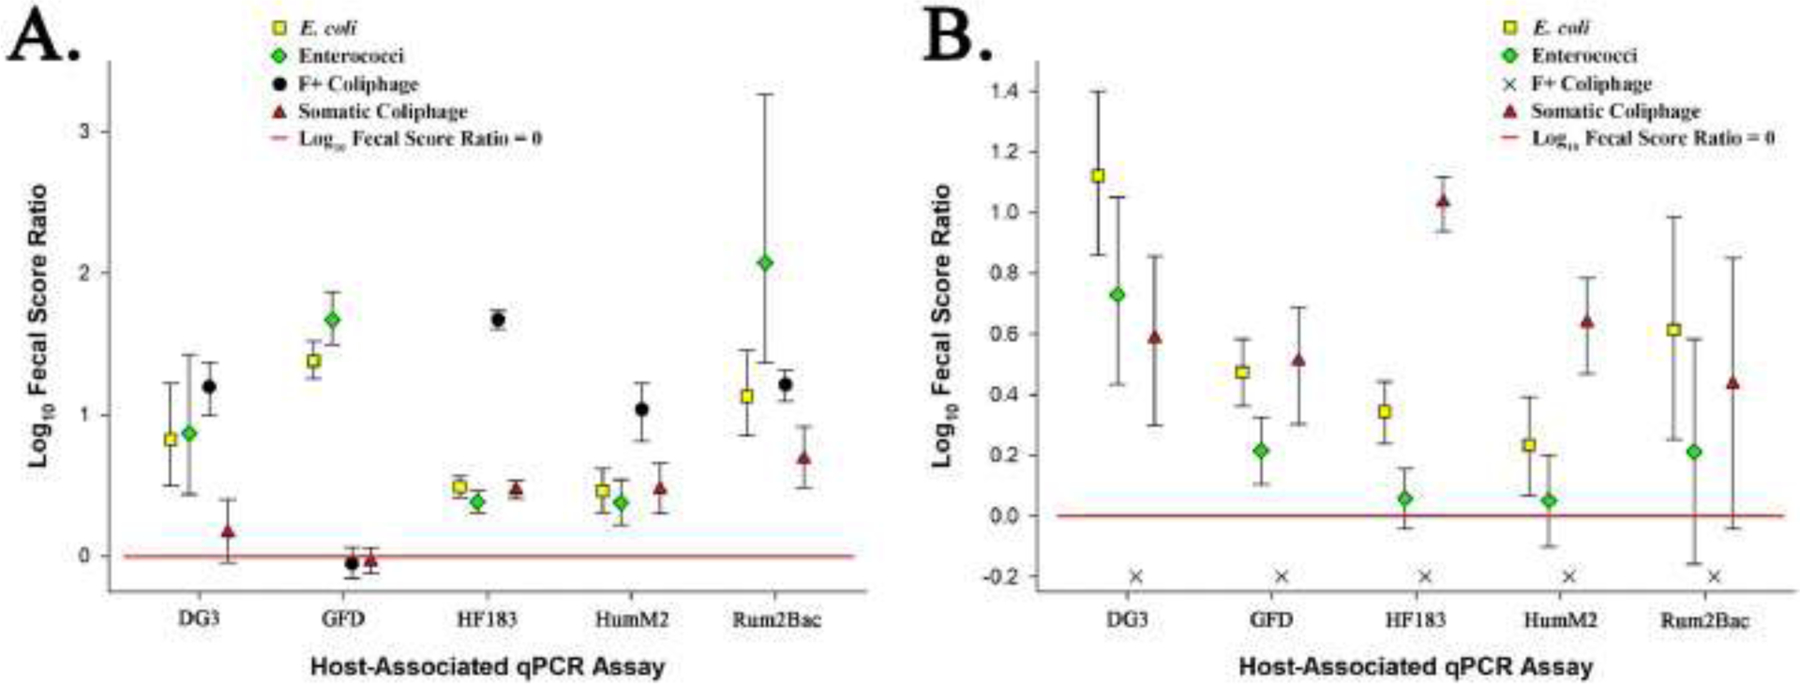
Fig. 5.

Scatter plot showing river (Panel A) and beach (Panel B) water type log10 fecal score ratios with 95% Bayesian credible intervals (BCI) for each fecal indicator definition-host-associated qPCR assay data grouping. Geometric symbols represent respective mean log10 fecal score ratios and error bars depict respective 95% BCI. The horizontal red line depicts a log10 fecal score ratio of zero. Mean log10 fecal score ratio values above the red line with no interval overlap indicate scenarios where the host-associated qPCR genetic marker average log10 concentration is significantly higher when waters are under advisory based on a respective general fecal indicator threshold values used in this study. An ‘X’ denotes that a general fecal indicator definition – water type data grouping was ineligible for fecal score ratio determination.
