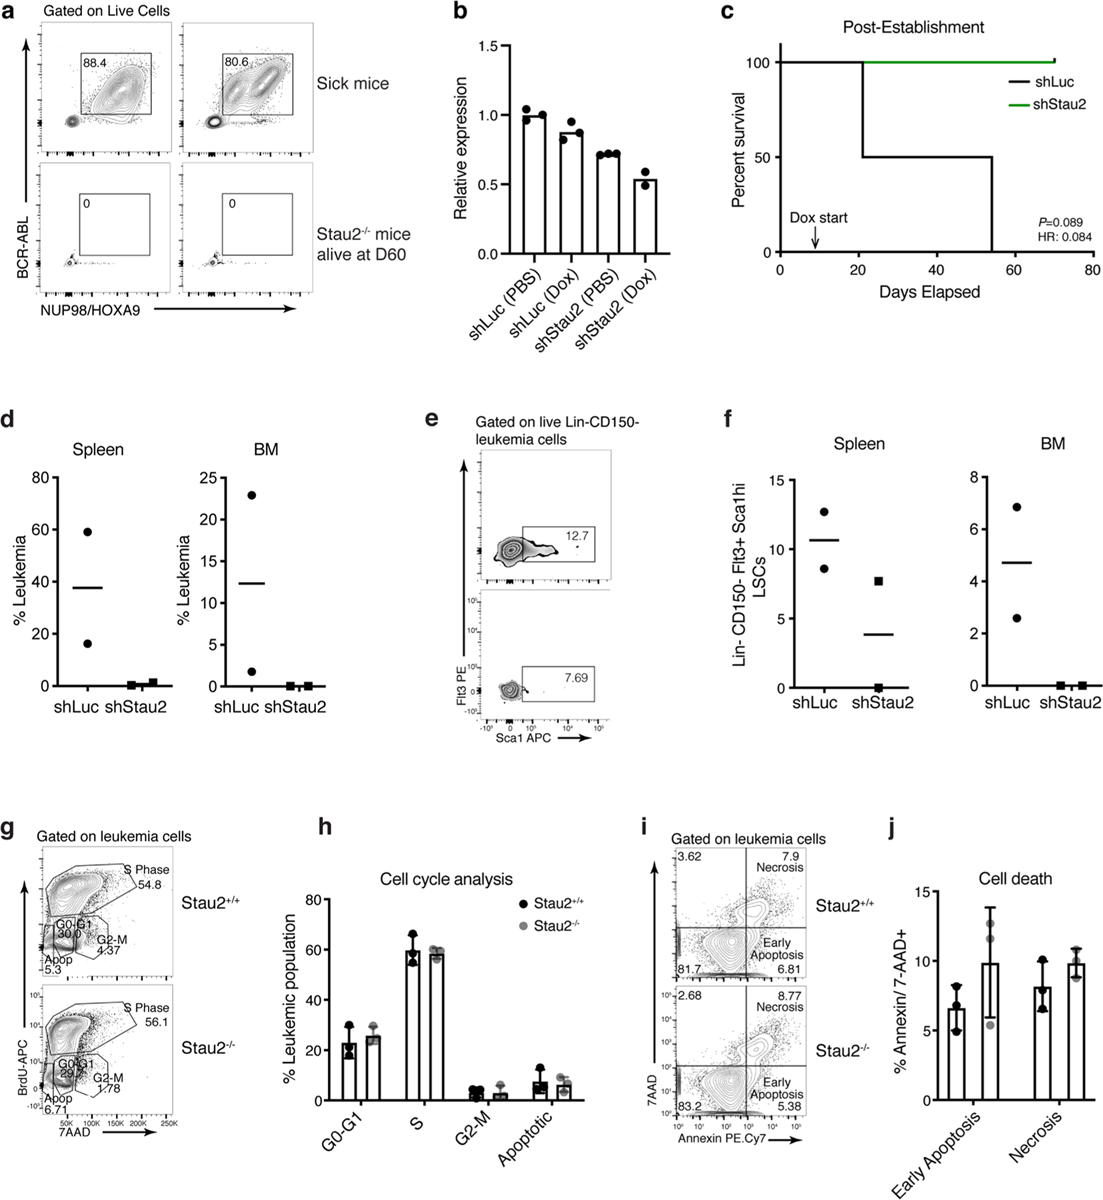
Extended Data Fig. 4 |. Role of Stau2 in bcCML progression.

a, Representative FACS plots show leukemia burden in control sick mice at disease end-point (top panel) and in Stau2−/− mice that did not develop disease 60d post-transplant (bottom panel; n = 2 animals per cohort). b, Relative Stau2 expression in Lin- bcCML cells transduced with inducible shLuc or shStau2. Cells were treated with PBS (control) or Doxycycline (to induce the shRNA expression) for 48 h in vitro and analyzed by qRT-PCR (n = 3 technical replicates per group except shStau2 Dox where n = 2). c, bcCML Lin- cells expressing doxycycline inducible control (shLuc) or Stau2 shRNAs (shStau2) were transplanted and recipients were given doxycycline water from day 6 post-transplant and survival monitored (n = 2 animals per cohort; data shown from one representative experiment, which was repeated with similar results, see Fig. 3g). d, Frequency of leukemia cells in the bone marrow and spleen of mice transplanted with shLuc and shStau2. shRNA expression was induced with doxycycline 6 days post-transplant and the bone marrow and spleen were analyzed 14d post-transplant (n = 2 animals per cohort, line represents median). e-f, Representative FACS plots (e) and graph (f) show the LSC frequency in mice transplanted with Lin-bcCML cells transduced with inducible shRNAs against control (shLuc) or Stau2 (n = 2 animals per cohort, line represents median). g-h, Lin- Stau2+/+ and Stau2−/− cells were transplanted into recipients. Thirteen days after transplant, mice were injected with bromodeoxyuridine (BrdU) and cells analyzed for incorporation 18 h later. Representative FACS plots show BrdU and 7AAD staining of BCR-ABL+Nup98−HOXA9+ Stau2+/+ and Stau2−/− leukemic cells (g). Average frequency of cells in distinct phases of the cell cycle (mean±S.D.; n = 3 animals per cohort) is shown (h). i-j, Representative FACS plots (i) and graph (j) show analysis of early and late apoptosis in BCR-ABL+NUP98-HOXA9+ leukemia cells 13 days post-transplant (mean±S.E.M; n = 3 animals per cohort).
