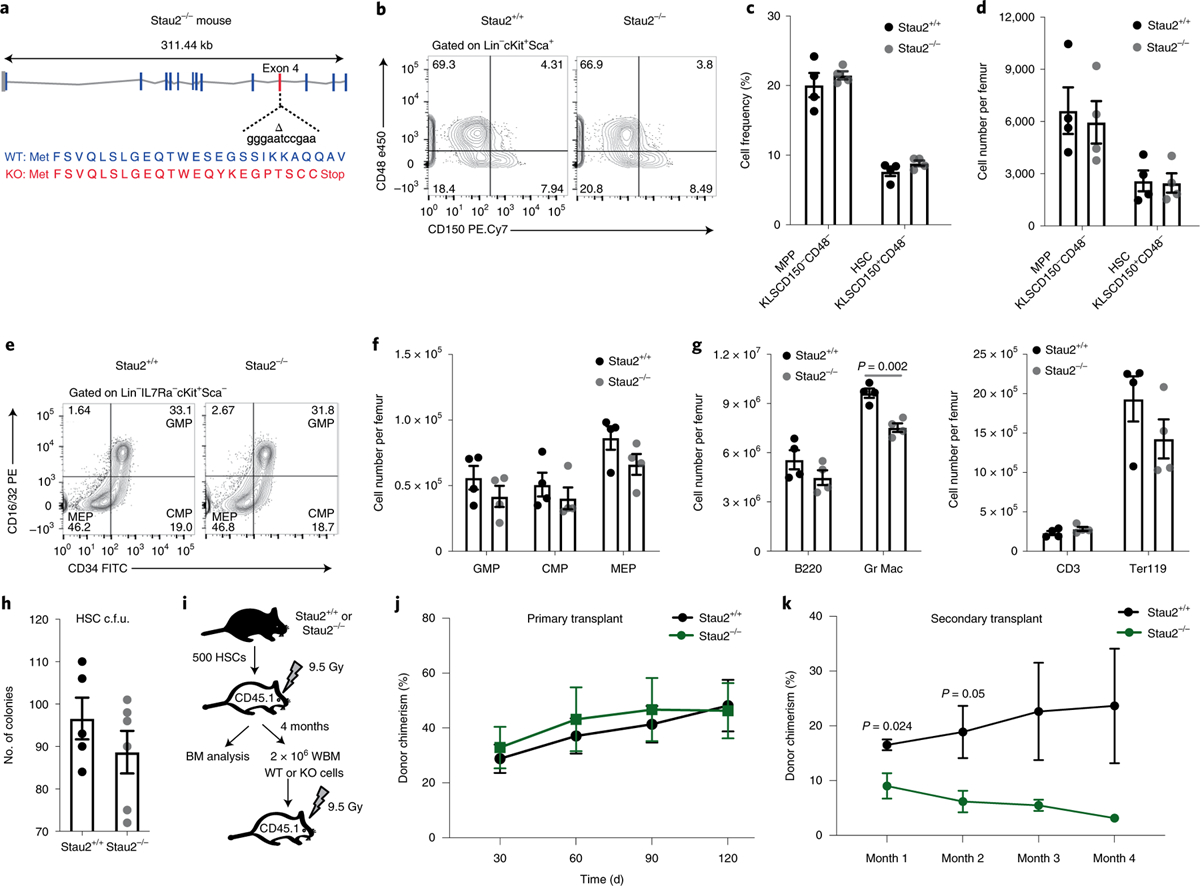
Fig. 2 |. Generation and analysis of Stau2 knockout mice.

a, Schematic diagram of the site targeted by a CRISPR guide to generate Stau2 knockout (KO) mice. WT, wild type. b–d, Representative fluorescence-activated cell sorting (FACS) plots (b) show HSC frequency in Stau2+/+ and Stau2−/− mice (gated on Lin−cKit+Sca+ (KLS) cells, where Lin+ is marked by CD3e, CD4, CD8, Gr1, CD11b/Mac-1, TER119, CD45R/B220 and CD19) (c,d). Graphs show the average frequencies and numbers (mean ± s.e.m.) of HSCs (KLSCD150+CD48−) and multipotent progenitors (MPPs, KLSCD150−CD48−) (n = 4 animals for each age- and sex-matched littermates; data are combined from three independent experiments). e,f, Representative FACS plots show the frequency and graphs show the number (mean ± s.e.m.) of committed progenitors (granulocyte–macrophage progenitor (GMP), Lin−IL7Ra−Kit+Sca1−CD34+CD16/3 2+; common myeloid progenitor (CMP), Lin−IL7Ra−Kit+Sca1−CD34+CD16/32−; megakaryocyte–erythroid progenitor (MEP), Lin−IL7Ra−Kit+Sca1−CD34−CD 16/32−) in Stau2+/+ and Stau2−/− mice (mean ± s.e.m.; n = 4 animals per cohort; data are combined from three independent experiments). g, Graph shows the total number of differentiated hematopoietic cells in bone marrow of Stau2+/+ and Stau2−/− mice (mean ± s.e.m.; n = 4 animals per cohort; two-tailed Student’s t-test; data are combined from three independent experiments). h, Colony-forming ability of Stau2+/+ and Stau2−/− HSCs (mean ± s.e.m.; n = 5 replicates for Stau2+/+ and n = 6 for Stau2−/−; data are combined from two independent experiments). c.f.u., colony-forming units. i, Schematic shows the experimental strategy used to determine the impact of Stau2 loss on the in vivo repopulating capacity and self-renewal ability of HSCs. BM, bone marrow; WBM, whole bone marrow. j,k, Graphs show average donor chimerism in the peripheral blood of primary and secondary transplant mice (n = 4 animals per cohort; two-tailed Student’s t-tests).
