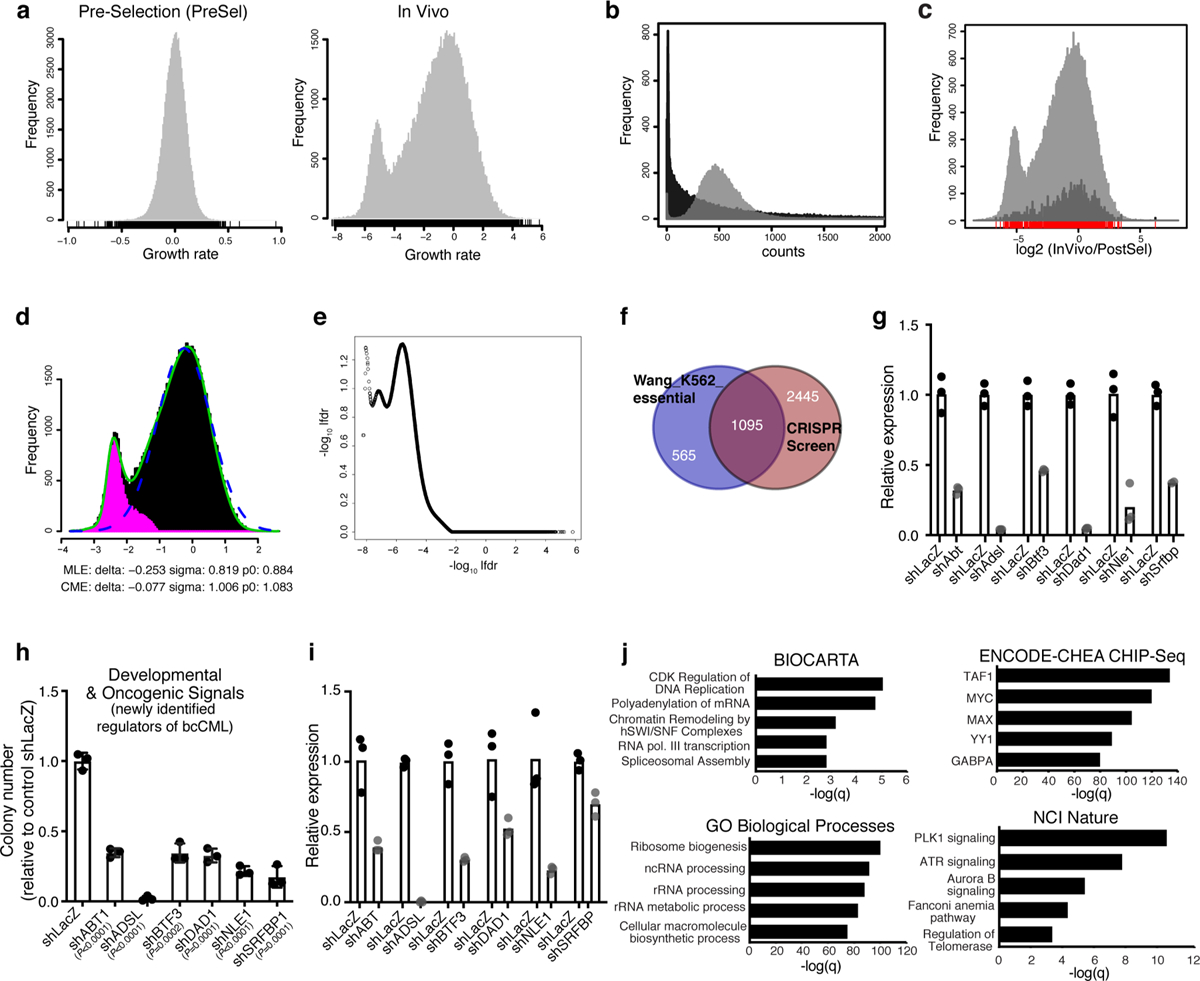
Extended Data Fig. 1 |. Genome-wide CRISPR screen in myeloid leukemia.

a, Histograms show the growth rates for samples Pre-selection (PreSel) and InVivo with respect to Post-selection (PostSel, control) for all sgRNAs in the Brie library. b, Histograms of sgRNA counts after in vitro selection (PostSel, grey histogram) and after in vivo selection (InVivo, black histogram). c, Graphical representation of sgRNA count ratio [log2 (InVivo/PostSel)] of all sgRNA species, including the controls (grey) or control sgRNA species alone (amplified by a factor of 10 for visibility, black). d, Plot showing method to identify genes with true selection in vivo. The x-coordinate is the z-statistic of the log2 count ratio at the gene level, between InVivo and PostSel. The green line is the actual distribution with the secondary peak; the dashed blue line is the empirical null distribution, and the pink histogram signifies estimated non-null genes (genes with true selection). e, Graphical representation of the CRISPR screen on a plot showing −log10lfdr versus log2(InVivo/PostSel). f, Venn diagram shows overlap between reported cell essential genes for K562 bcCML cells19 (n = 1660) and genes that are depleted by 3-fold or more in the in vivo CRISPR screen (n = 3540); p < 0.0001 (hypergeometric probability formula). g, Relative RNA expression of the indicated genes in NIH-3T3 cells expressing the indicated shRNAs against novel leukemia regulators relative to control shLacZ (n = 3 technical replicates per group). h, Impact on colony forming ability of K562 cells transduced with lentiviral shRNAs against the indicated novel leukemia regulators relative to control (shLacZ) (n = 3 independent culture wells per group; two-tailed Student’s t-tests). i, Relative RNA expression of the indicated genes in K562 cells expressing the indicated shRNAs against novel leukemia regulators relative to control shLacZ (n = 3 technical replicates). j, Enriched molecular programs identified from the Enrichr analysis of genes that were depleted by 3-fold or more in vivo as compared to input (n = 3540; Fisher’s exact test).
