
Figure 4: The Mediterranean diet is associated with microbial processes involved in plant polysaccharide degradation and short-chain fatty acid production.
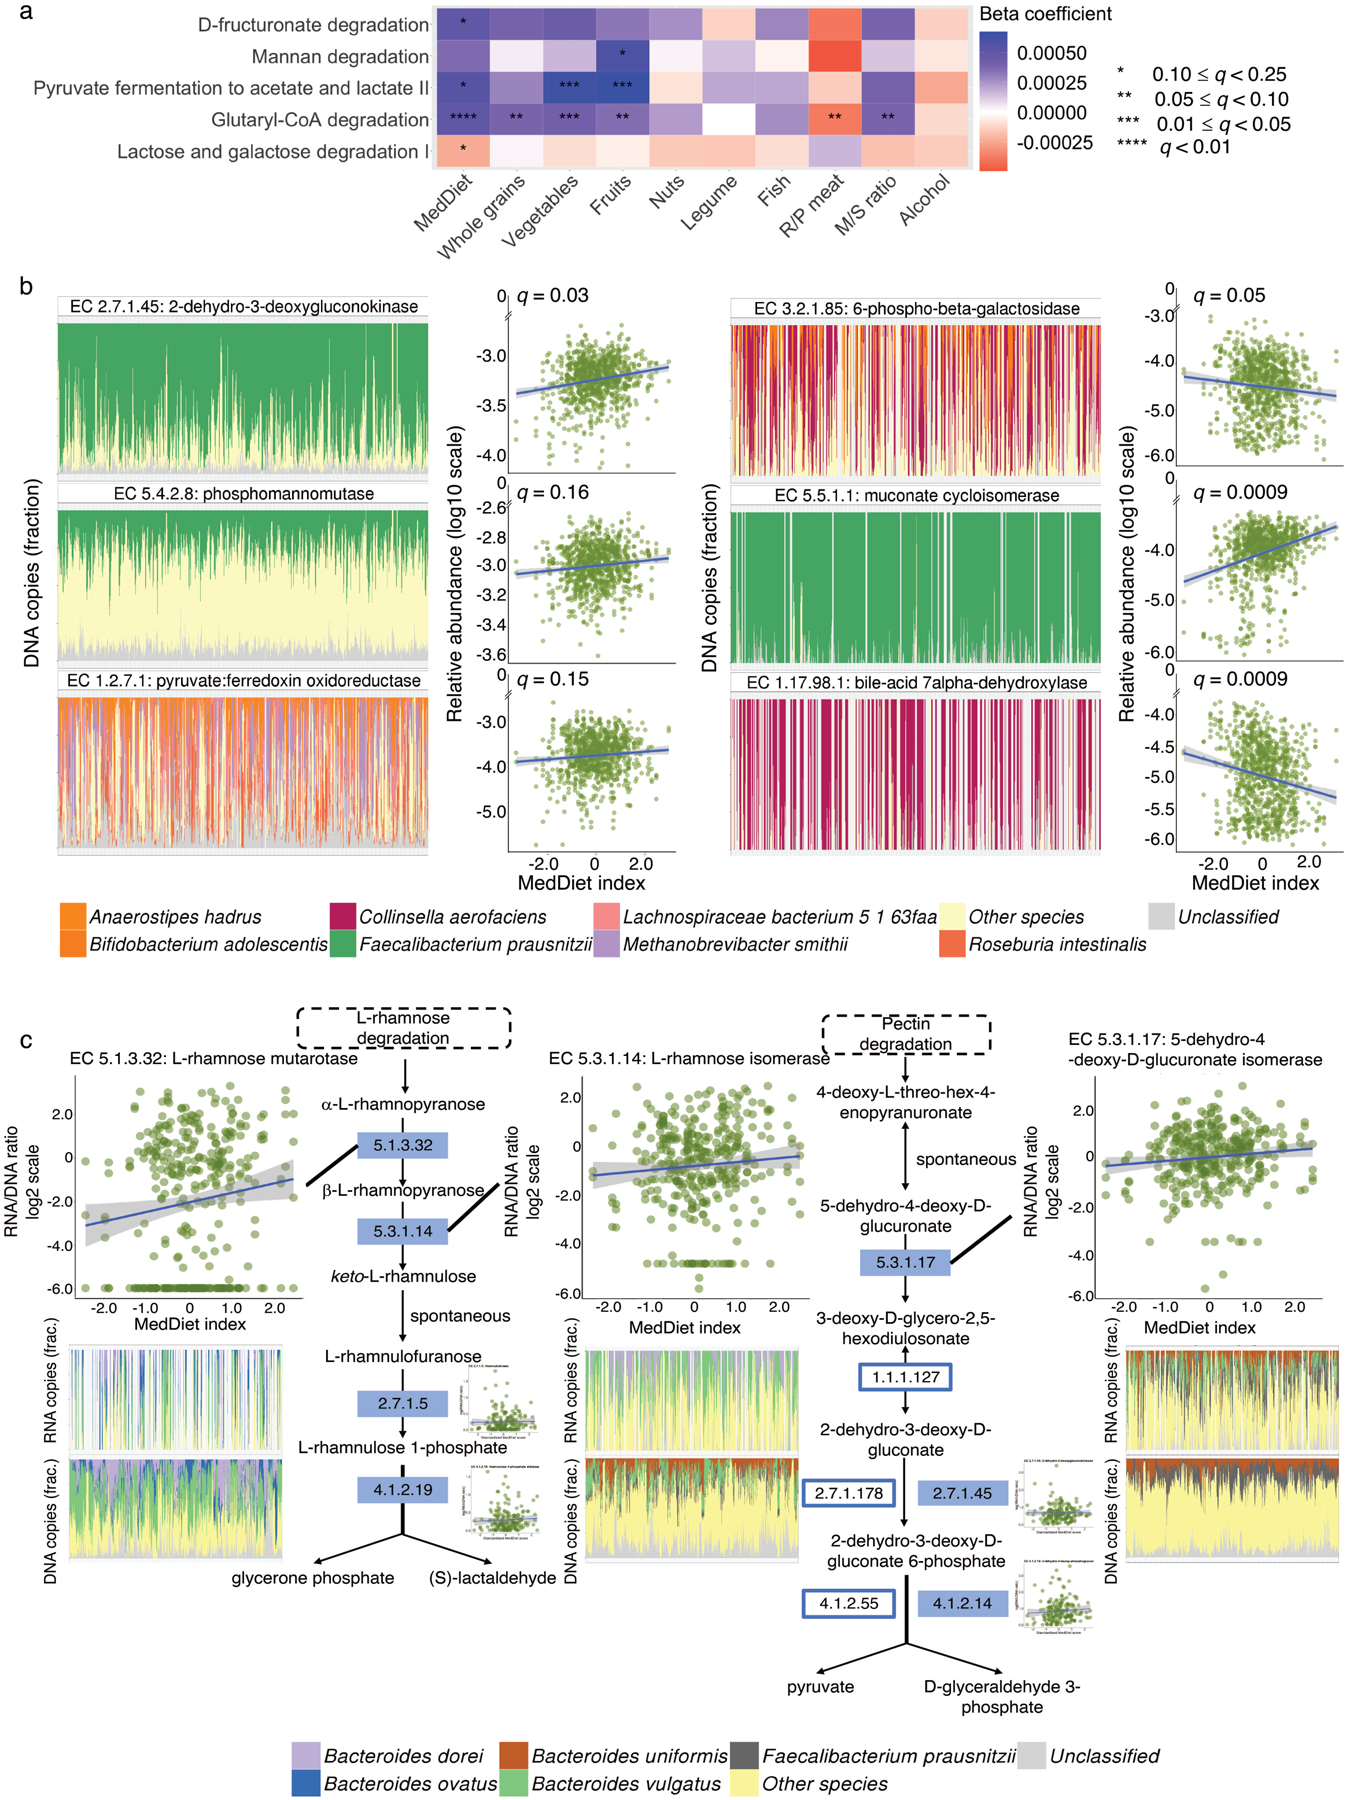
(a) Associations of the Mediterranean diet (MedDiet) and its constituent foods and nutrients with microbial functions (as MetaCyc pathways) involved in plant-derived polysaccharide degradation, short-chain fatty acid (SCFA) production, and lactose degradation. Beta coefficients are derived from multivariable-adjusted linear mixed models (Methods) that include the MedDiet index or a dietary factor as independent variable and abundance of microbial pathway as dependent variable (exact q-values in Source Data). (b) A subset of associations of the MedDiet with enzymes (as Enzyme Commission numbers) encoded in microbial genomes that are involved in plant-derived polysaccharide degradation, SCFA production, lignin degradation, secondary bile acid production, and lactose degradation (full results in Supplementary Table 6). Q-values (false discovery rate adjusted p-value) in (a) and (b) were derived from multivariable-adjusted linear mixed models, with multiple comparison adjustment using the Benjamini-Hochberg method with a target rate of 0.25 (Methods). Analyses in (a) and (b) use all 925 metagenomes. (c) Associations of the MedDiet with the transcription of enzymes within the pathways of L-rhamnose and pectin degradation, using 340 metatranscriptome and metagenome pairs from 96 participants. The plots in (c) are schematic representations of several pathways containing key enzymes for L-rhamnose and pectin degradation. Solid rectangles indicate those quantified from both metagenomes and metatranscriptomes. We used Enzyme Commission numbers in the rectangles to represent these enzymes. The scatter plots in (b) and (c) show the associations of the MedDiet index with relative abundance or transcription levels of microbial enzymes. The bar plots in (b) and (c) show the microbial species with the greatest contributions to each microbial enzyme, with metagenomic or metatranscriptomic samples along the X axes ordered by the MedDiet index (from the lowest to the highest). All the statistical tests were two-sided.