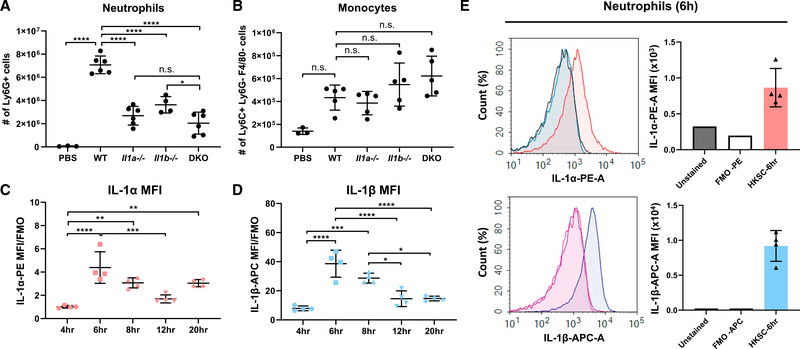
Figure 1. Neutrophils are a source of IL-1α in A. fumigatus-induced peritonitis.
(A and B) Neutrophils (A) and monocytes (B) were quantified by flow cytometry 24 h after i.p. injection of heat-killed A. fumigatus conidia into WT, IL-1α−/−, IL-1β−/−, or IL-1α−/−/IL-1β−/− DKO mice. Cell numbers shown are percentage of each cell type 3 total cell count.
(C and D) MFI of intracellular IL-1α (C) and IL-1β (D) in neutrophils from the peritoneal cavity at multiple time points after injection of A. fumigatus conidia. IL-1α MFI and IL-1β MFI were normalized to FMO control (n = 4).
(E) Representative histogram and corresponding MFI levels after 6-h incubation (n = 4). Each data point represents an individual mouse. Experiments were repeated twice with similar results.
Significance was calculated by one-way ANOVA followed by Dunnett’s multiple comparisons test. *p < 0.05, **p < 0.01, ***p < 0.001, ****p < 0.0001.

