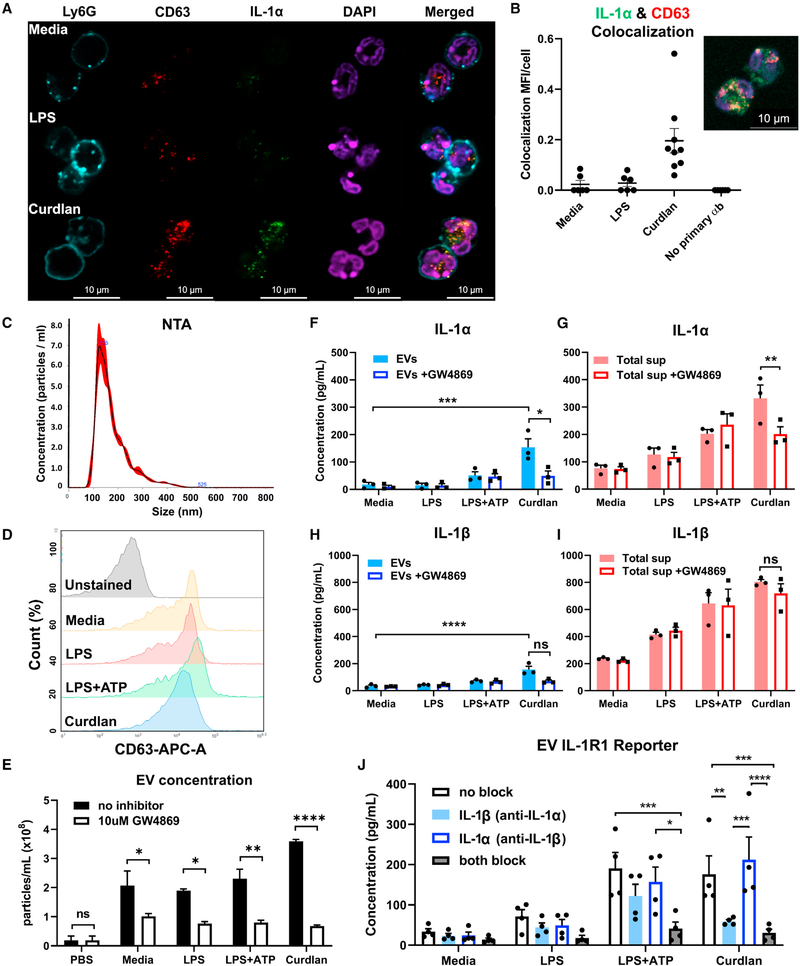
Figure 4. Exosomal release of IL-1α by neutrophils.
(A) Representative confocal images of peritoneal neutrophils stimulated with LPS or curdlan for 6 h.
(B) Quantification of IL-1α and CD63 co-localization using ImageJ (each data point represents a single cell).
(C) NTA of EV size distribution and concentration.
(D–G) Neutrophils were stimulated in the presence of exosome inhibitor GW4869, and IL-1α and IL-1β were quantified by ELISA in isolated EVs following lysis (D and F) and in total cell-free supernatants (E and G).
(H) Inhibition of EV secretion shown by NTA.
(I) Bioactive IL-1 signaling through IL-1R1 reporter cells was measured in isolated exosomes in the absence of detergent lysis (n = 4). Neutralizing antibodies (Abs) to IL-1α, IL-1β, or both cytokines were included in the reporter assay, and bioactive cytokine concentration was calculated based on a standard curve using recombinant IL-1α and IL-1β.
Two-way ANOVA with Tukey’s multiple comparisons test. *p < 0.05, **p < 0.01, ***p < 0.001, ****p < 0.0001. Experiments in (A) and (B) were repeated three times; (C)–(G) are biological replicates from repeat experiments.

