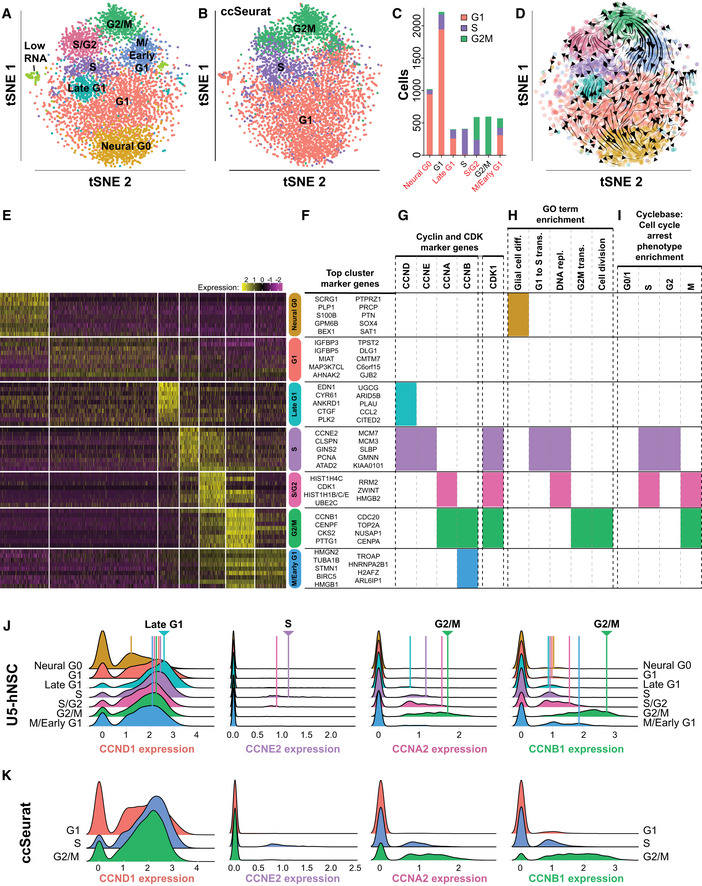
Eight transcriptional clusters were discovered from unsorted U5‐hNSCs using an unsupervised graph‐based clustering method. Single cells were embedded into a two‐dimensional space for visualization using t‐Distributed Stochastic Neighbor Embedding (tSNE).
The ccSeurat classifier was applied to the unsorted U5‐hNSCs. The G1, S, and G2M phase calls were overlaid onto the tSNE embedding.
The number of cells for each U5‐hNSC defined cell cycle phase colorized by the three ccSeurat classifier phases. Names for new U5‐hNSC defined cell cycle phases are red.
RNA velocity stream plot for U5‐hNSCs shows the directional flow of cells through the phases of the cell cycle (i.e., G1 → Late G1 → S → S/G2 → G2/M → M/Early G1 → G1) and into the novel Neural G0 phase.
Heat map of the relative expression (row‐wise z‐score) for the top 10 non‐redundant genes for each prominent cluster in U5‐NSCs and gene ontology analysis of the up‐regulated genes defining each cluster.
Top marker genes for each cluster.
Cyclin and CDK marker genes found for each cluster.
Functional GO term enrichment for key cell cycle‐related and “glial cell differentiation” terms. Full cluster‐defining gene list is in Dataset
EV1, and full gene ontology is in Dataset
EV2.
Enrichment of knockdown cell cycle arrest phenotype genes for each cluster.
Ridge graph comparisons of cyclin expression across the U5‐hNSC defined cell cycle phases. The x‐axis is relative expression of the cyclin, and the y‐axis is counts of cells per phase. The cell cycle phase with the peak expression is denoted by an arrowhead at the top of the plot.
Ridge graph comparison of cyclin expression across the Seurat‐classified cell cycle phases. The x‐axis is relative expression of the cyclin, and the y‐axis is counts of cells per phase.

