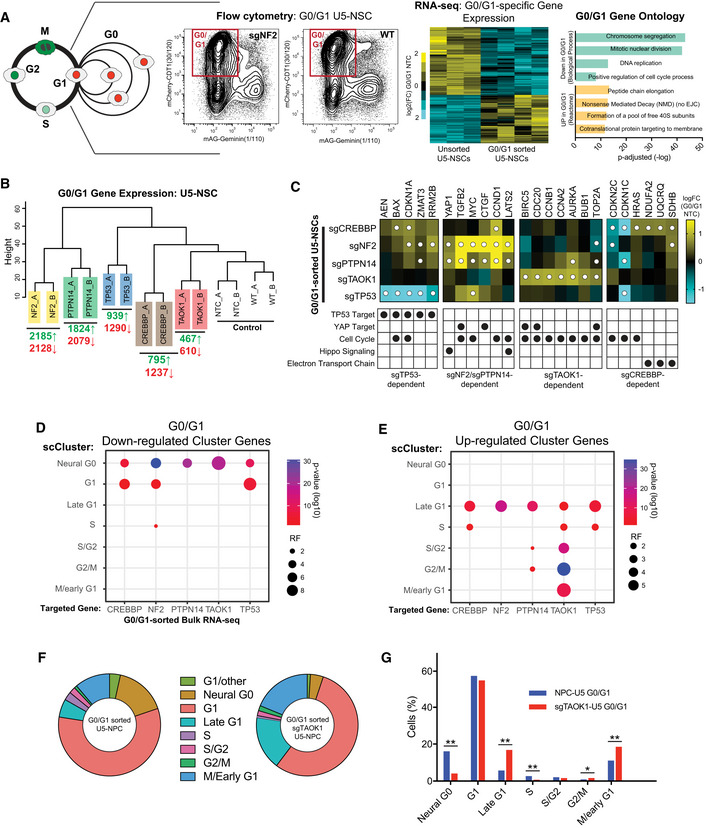
Figure 7. Transcriptional reprogramming of G0/G1 following loss of G0‐skip genes.

-
ASchematic of G0/G1 sorting for gene expression analysis: mCherry‐CDT1+ U5‐NSCs (red box), heat maps of log2(fold‐change) between G0/G1 NTC the significantly altered genes (FDR < 0.05) between WT unsorted U5‐NSCs and non‐targeting control (NTC) and WT G0/G1 U5‐NSCs, and gene ontology analysis (Young et al, 2010) of some of the top biological processes down‐regulated and reactome groups (Yu & He, 2016) up‐regulated in the G0/G1‐sorted cells. Full list in Datasets EV10 and EV11.
-
BDendrogram of unbiased hierarchical clustering of gene expression from G0/G1‐sorted U5‐NSCs with the number genes up (green) and down (red) regulated (FDR < 0.05) in each KO compared to NTC. Complete results in Dataset EV10.
-
CHeat map of log2FC compared to NTC for key genes changed in G0/G1 in following loss of TP53, NF2/PTPN14, TAOK1, and/or CREBBP, including genes from TP53 targets, YAP targets, the cell cycle, Hippo signaling, and electron transport genes. White dots indicate FDR < 0.05.
-
D, ESignificance of overlap of the down (D)‐ and up (E)‐regulated genes from bulk RNA sequencing of G0/G1‐sorted cells with the single‐cell cluster definitions (up‐regulated genes). Significance assessed through hypergeometric enrichment test P‐values. RF = representation factor.
-
FFraction of cells classified by ccAF into the cell cycle phases for scRNA‐seq profiles from CDT+ sorted WT and sgTAOK1 U5‐NSCs.
-
GComparison of the proportions of each cell cycle phase between CDT+ sorted WT and sgTAOK1 U5‐NSCs. Significance was assessed using the proportion test. *≤ 0.05; **≤ 1 × 10⁻⁶.
