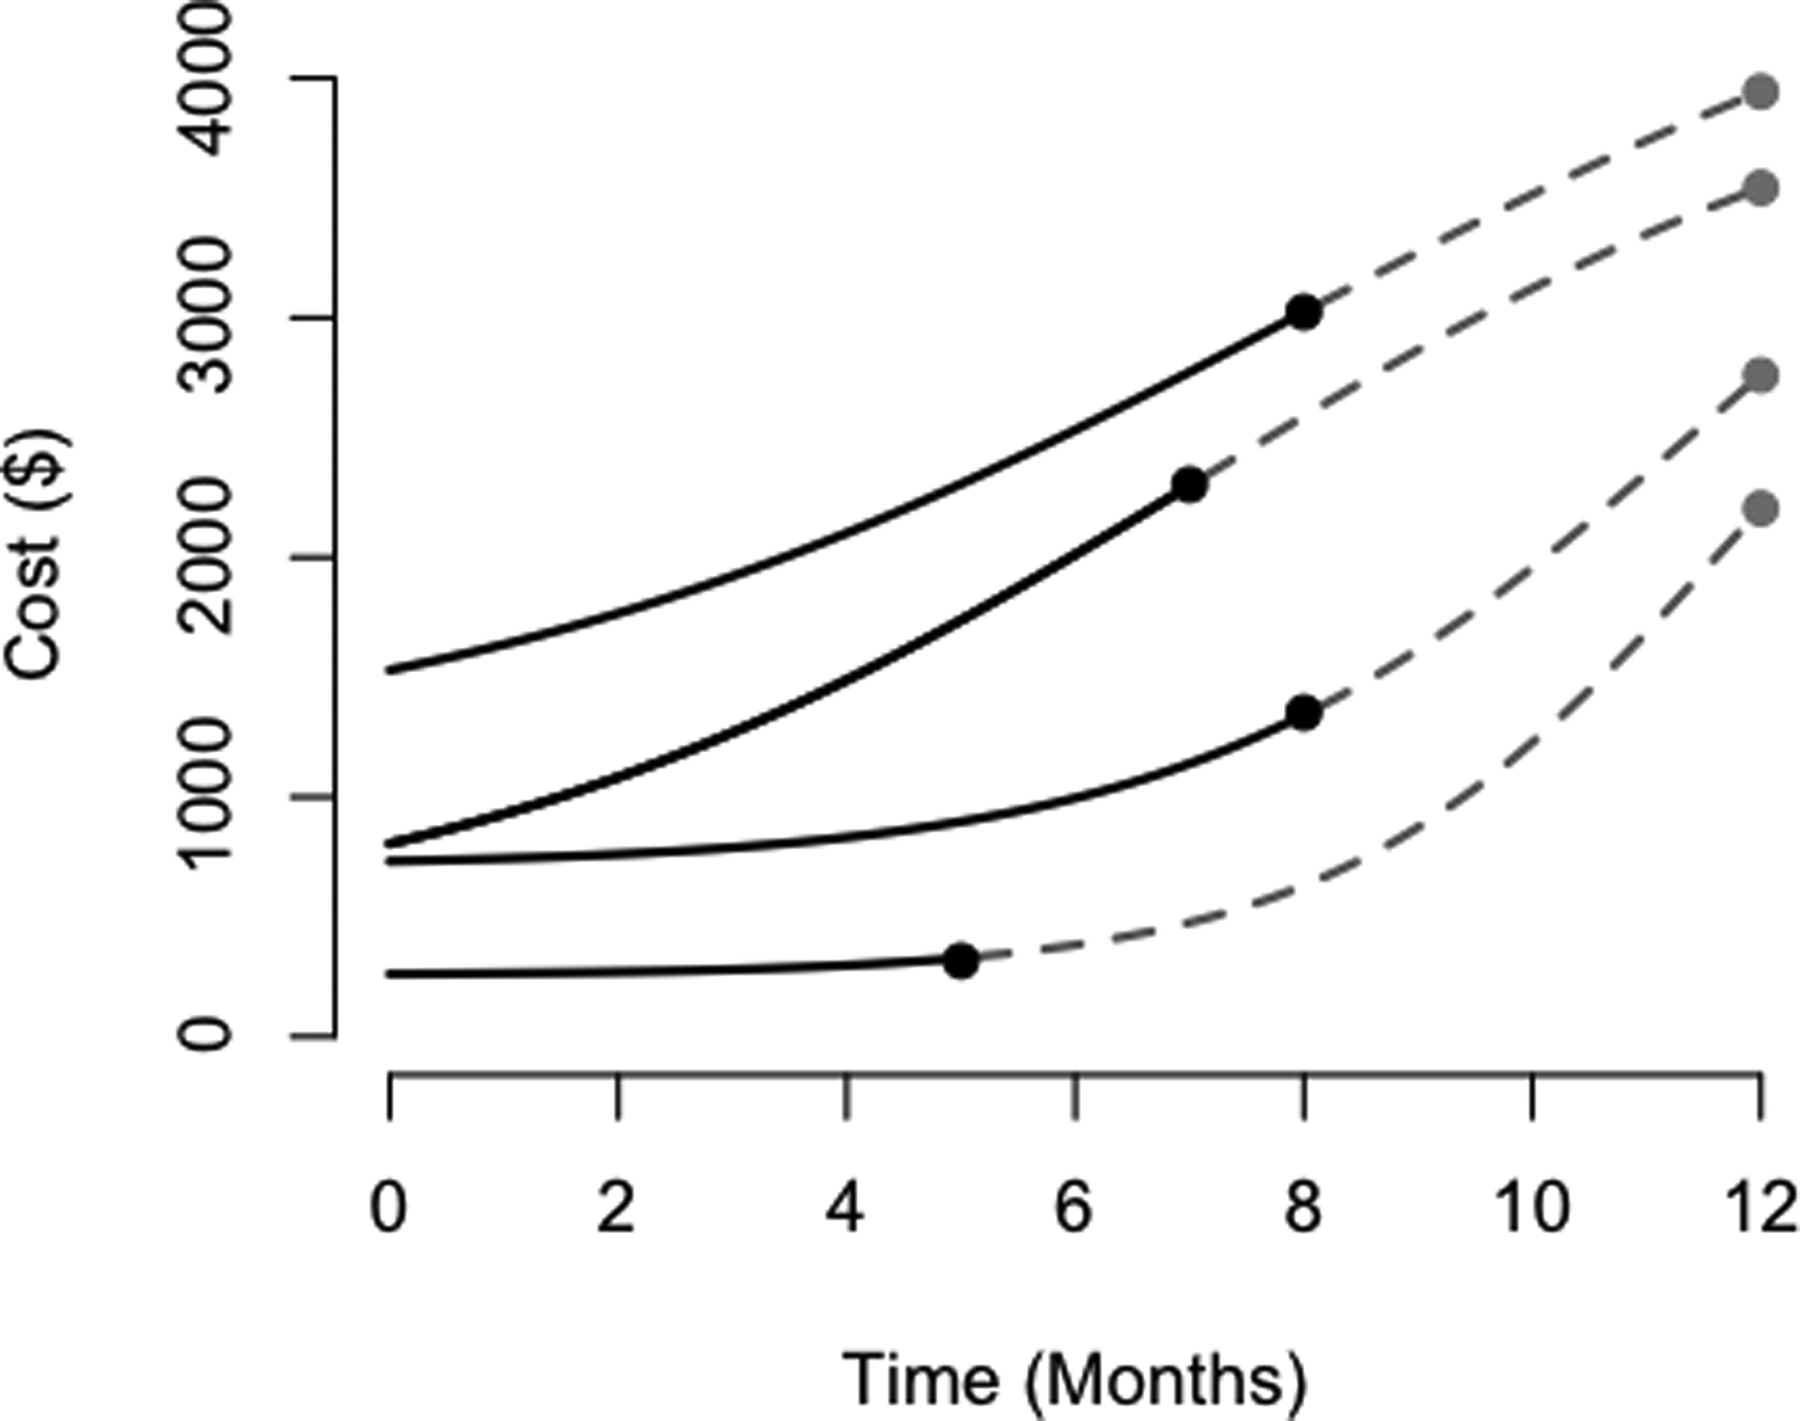
Figure 1:

Here, we illustrate informative cost trajectories; in particular, cumulative costs at time of censoring are correlated with theoretical cumulative cost over one year, despite the censoring times being generated independently of the cost outcome (for each of these trajectories, the time range of interest is a constant twelve months for all patients, and hence the time of censoring is uncorrelated with the total time of interest). Observed portions of cost trajectories are plotted over time as solid black curves for censored individuals until their time of censoring. The hypothetical remainder of their trajectories are plotted as dashed gray curves until the time of study completion. The curves in this figure do not cross for ease of demonstration, though they may cross in practice.
