Figure 5:

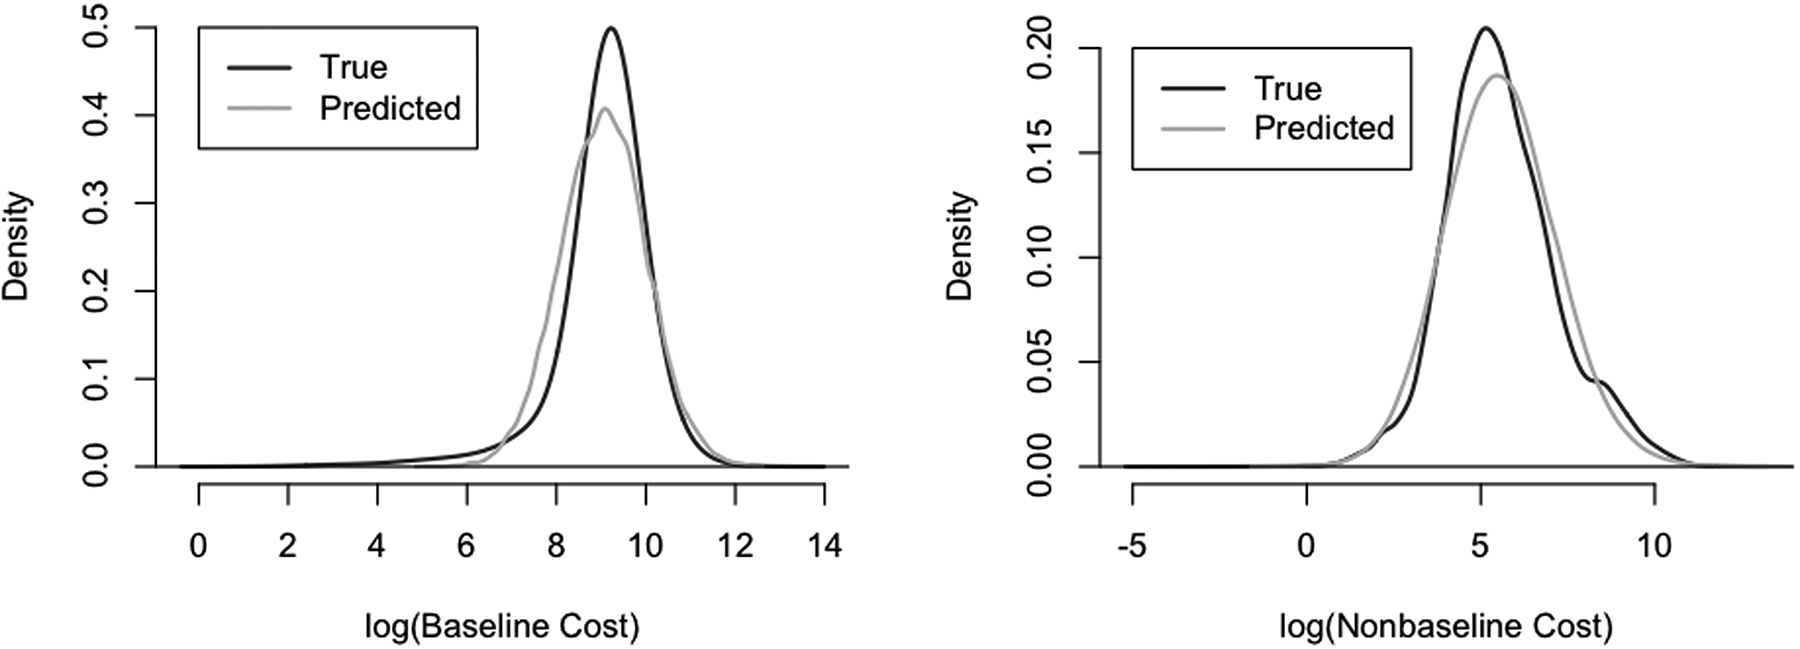
Kernel density plots of the predicted and true log-costs at baseline (left) and follow-up (right). The random draws generated appear to formulate a density that closely mirrors the empirical density from the data.

Kernel density plots of the predicted and true log-costs at baseline (left) and follow-up (right). The random draws generated appear to formulate a density that closely mirrors the empirical density from the data.