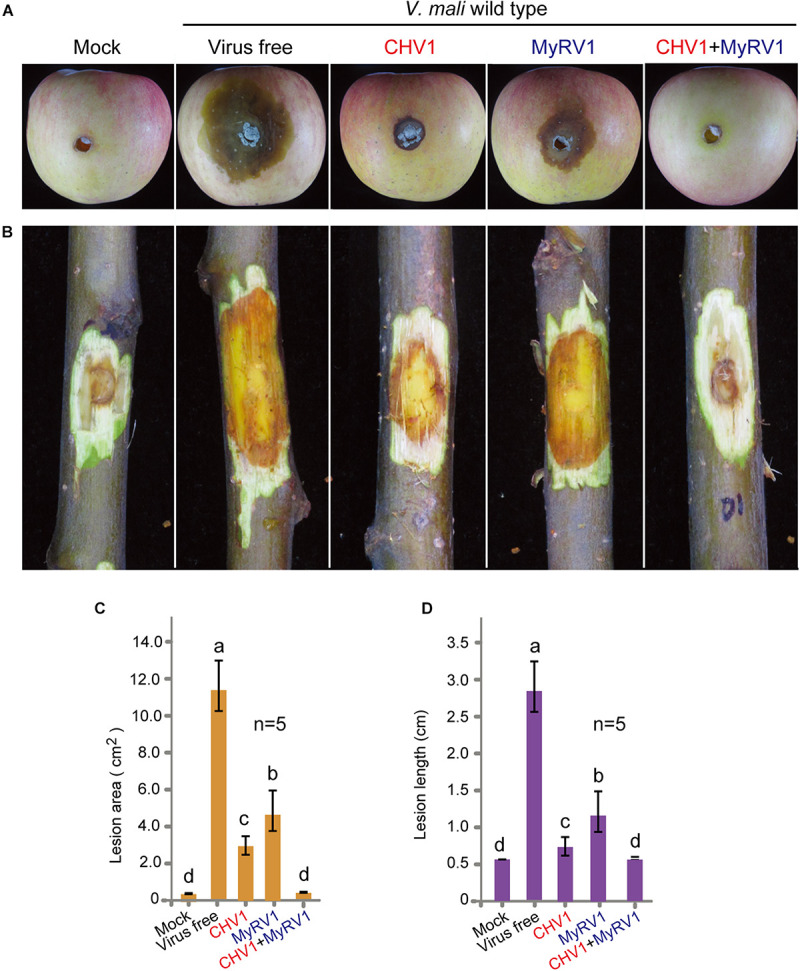
FIGURE 2.

The virulence levels of V. mali strains singly or doubly infected with CHV1 and MyRV1. (A) Representative images showing lesions on apples induced by V. mali strains. The cankers were photographed at 5 days post-inoculation. (B) Representative images showing lesions on apple twigs induced by V. mali strains. The lesions on twigs were photographed at 5 days post-inoculation. (C) Lesion areas on apples measured in the experiment described in (A). The data are the means ± SD (n = 5). The different letters indicate a significant difference at p < 0.01 (one-way ANOVA). (D) Lesion lengths on apple twigs measured in the experiment described in (B). The data are the means ± SD (n = 5). The different letters indicate a significant difference at p < 0.01 (one-way ANOVA).
