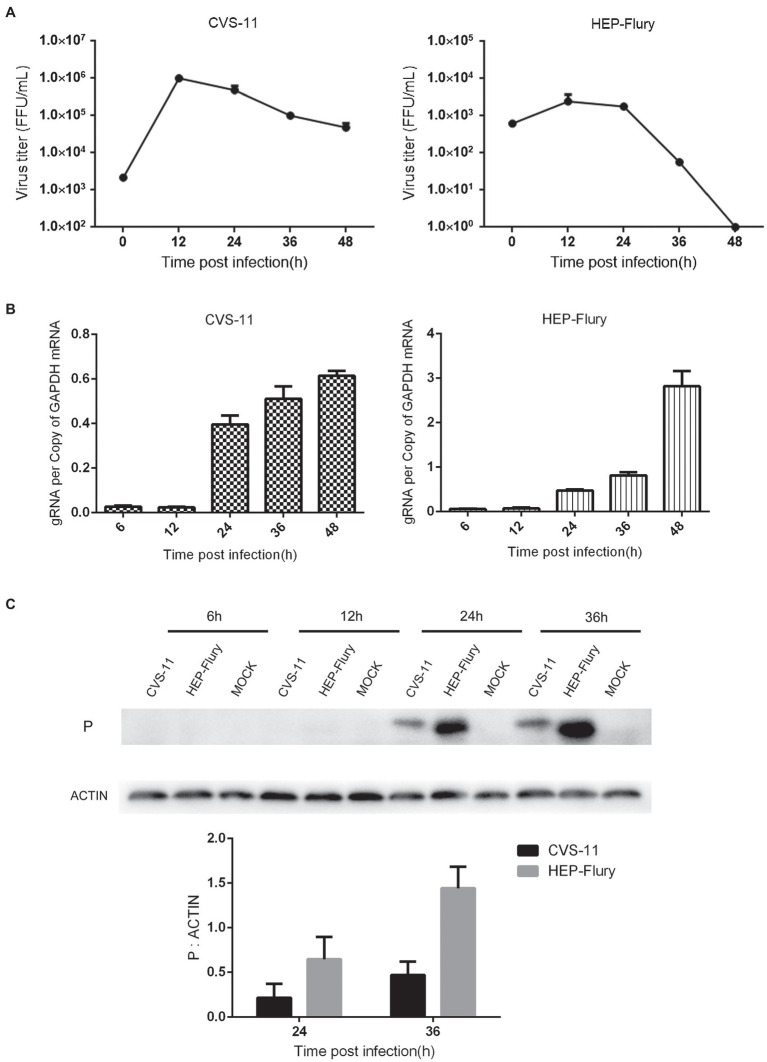
Figure 1.
Growth characteristics of the RABV on BV2 cells. (A) Growth curves of RABV in BV2 cells. BV2 cells were infected with CVS-11 or HEP-Flury at an MOI of 1 and continuously cultured at 37°C. Cultured supernatants were collected at 12, 24, 36, and 48 hpi. Then, viral titrations were performed by direct fluorescent antibody assay. Virus titers were assayed in triplicate. Data are shown as mean ± SD. (B) Detection of RABV gRNA by RT-qPCR. BV2 cells were, respectively, infected with CVS-11 or HEP-Flury at an MOI of 1. Cells were harvested at 6, 12, 24, 36, and 48 hpi. The levels of gRNA in BV2 cells were determined by RT-qPCR using a CFX connect real-time system. The relative gRNA levels were normalized to GAPDH. Data are presented as mean ± SD, n = 3. (C) Detection of structural protein expression by Western blot. BV2 cells were, respectively, infected with CVS-11 or HEP-Flury at an MOI of 1. Cell lysates were harvested at 6, 12, 24, and 36 hpi for Western blot analysis. The results present the relative expression levels of rabies phosphoprotein and β-actin visualized using the ImageJ software. Data are shown as mean ± SD, n = 3.

