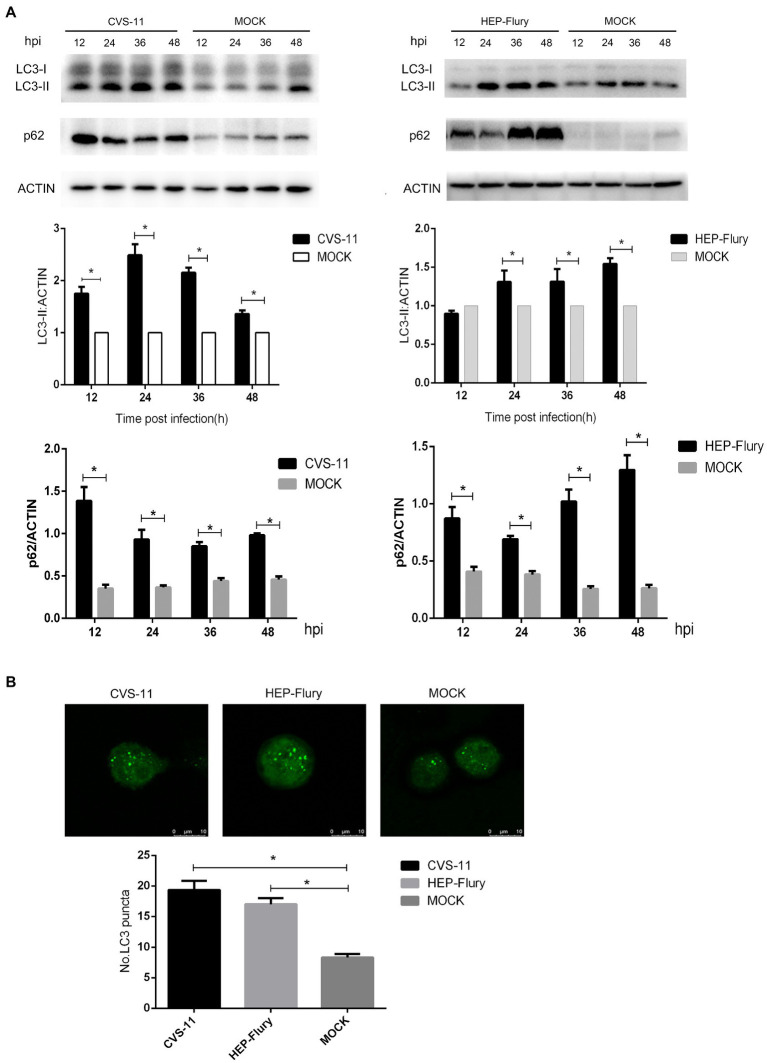
Figure 2.
Autophagy induced by RABV in BV2 cells. (A) Western blotting to analyze the expression of LC3 and p62 protein. BV2 cells were, respectively, infected with CVS-11 at an MOI of 10 or HEP-Flury at an MOI of 3. Cell lysates were harvested at 12, 24, 36, and 48 hpi. Western blot analysis was used to assess the relative expression levels of LC3-II, p62, and β-actin. Data are represented as mean ± SD, n = 3. Asterisks indicate significant differences between the groups calculated using a Student’s t-test (*p < 0.05). (B) LC3 dots in BV2 under laser confocal fluorescence microscopy. BV2 cells were transfected with plasmids and then infected with CVS-11 or HEP-Flury at an MOI of 3. The fluorescent dots in BV2 cells were directly observed at 12 hpi. The average number of LC3 dots was determined from at least 50 cells in each group. Data are represented as mean ± SD of three independent experiments. Asterisks indicate significant differences between the groups calculated using a Student’s t-test (*p < 0.05).

