Figure 2.

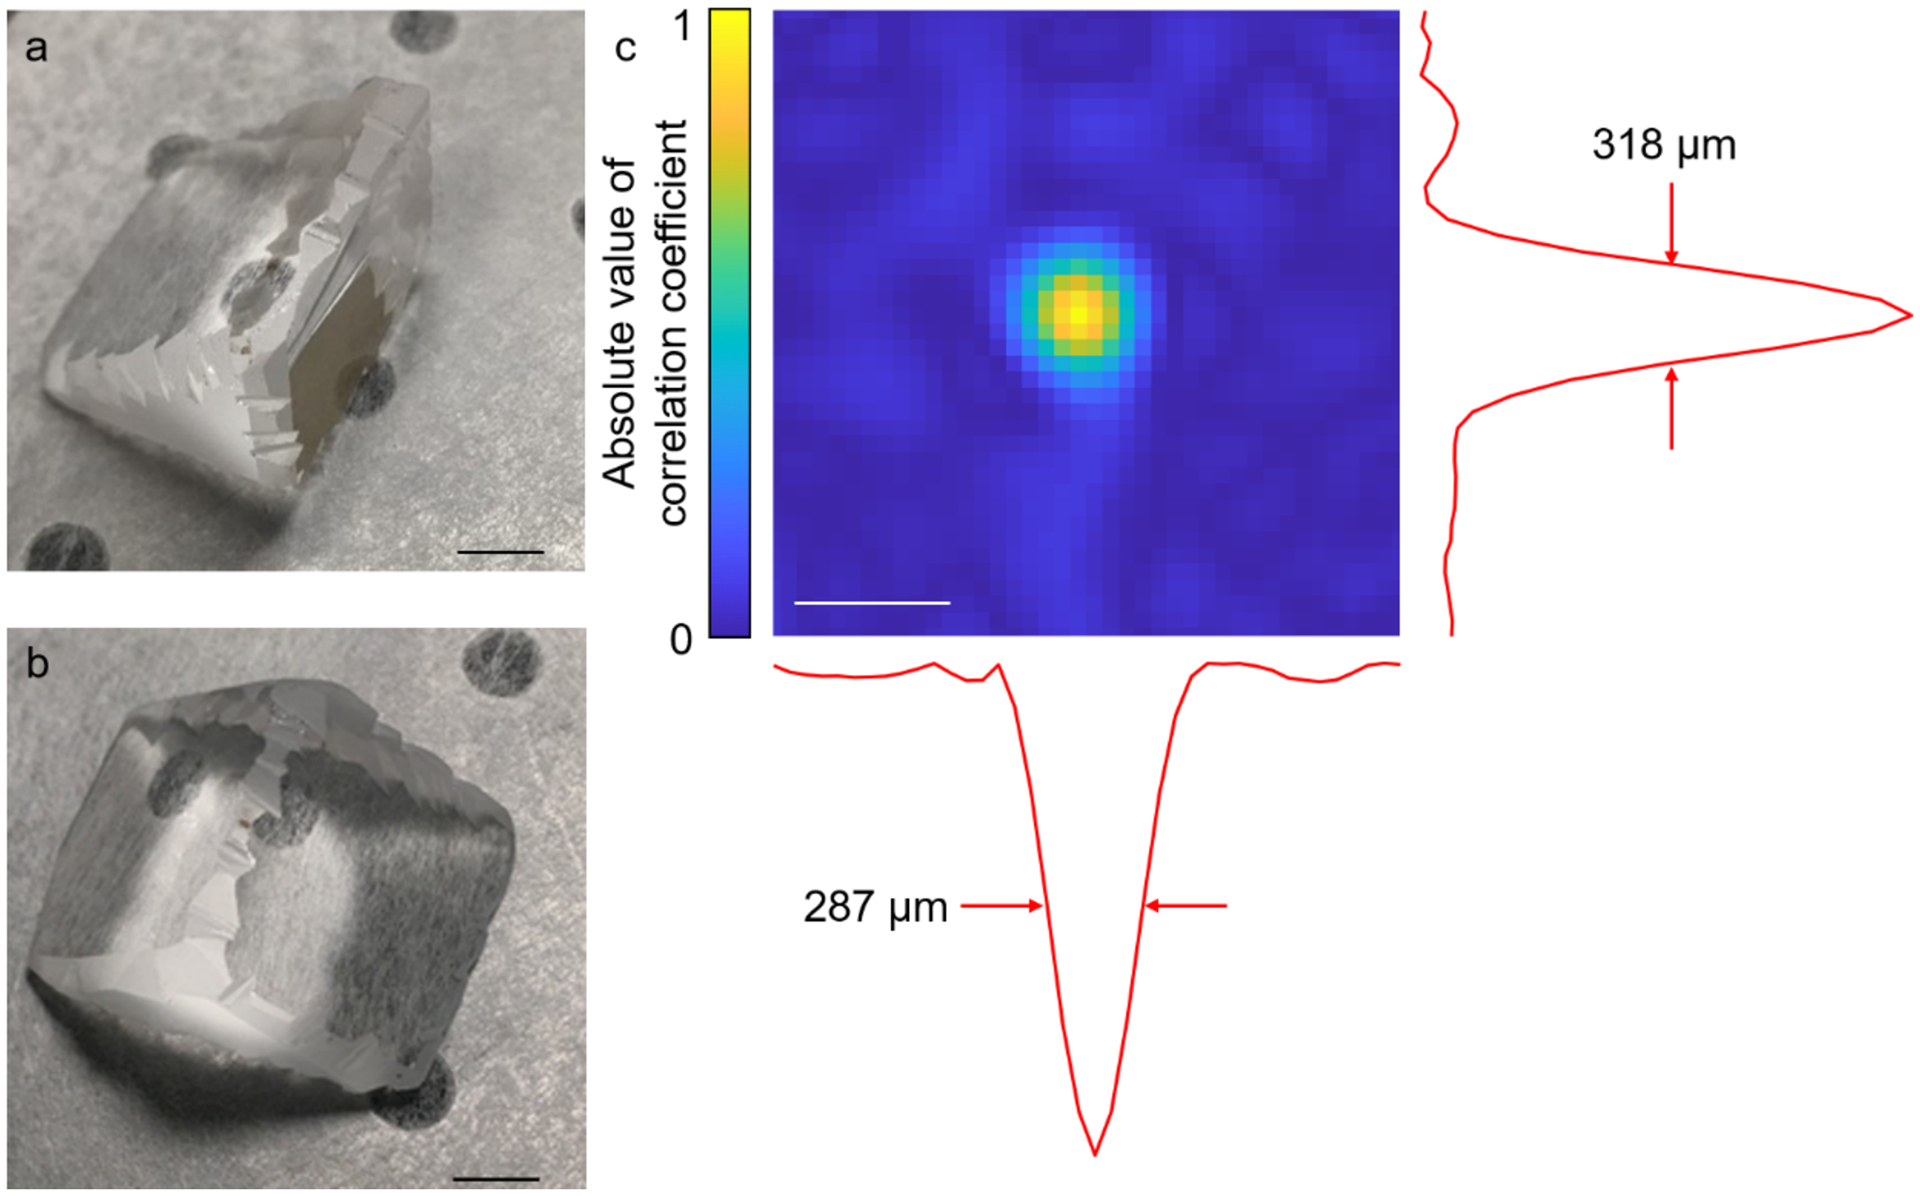
The ER and the spatial resolution of PATER. (a, b) Photos of the ER, which is based on a UV fused silica right-angle prism. The edges are ground to ensure the ergodicity of the prism. Scale bar, 5 mm. (c) Cross-correlation map generated from the correlation coefficients between the calibration signal of the center pixel and the signals of all the pixels in the FOV, showing the spatial resolution of PATER. Scale bar, 500 μm.
