Figure 7.

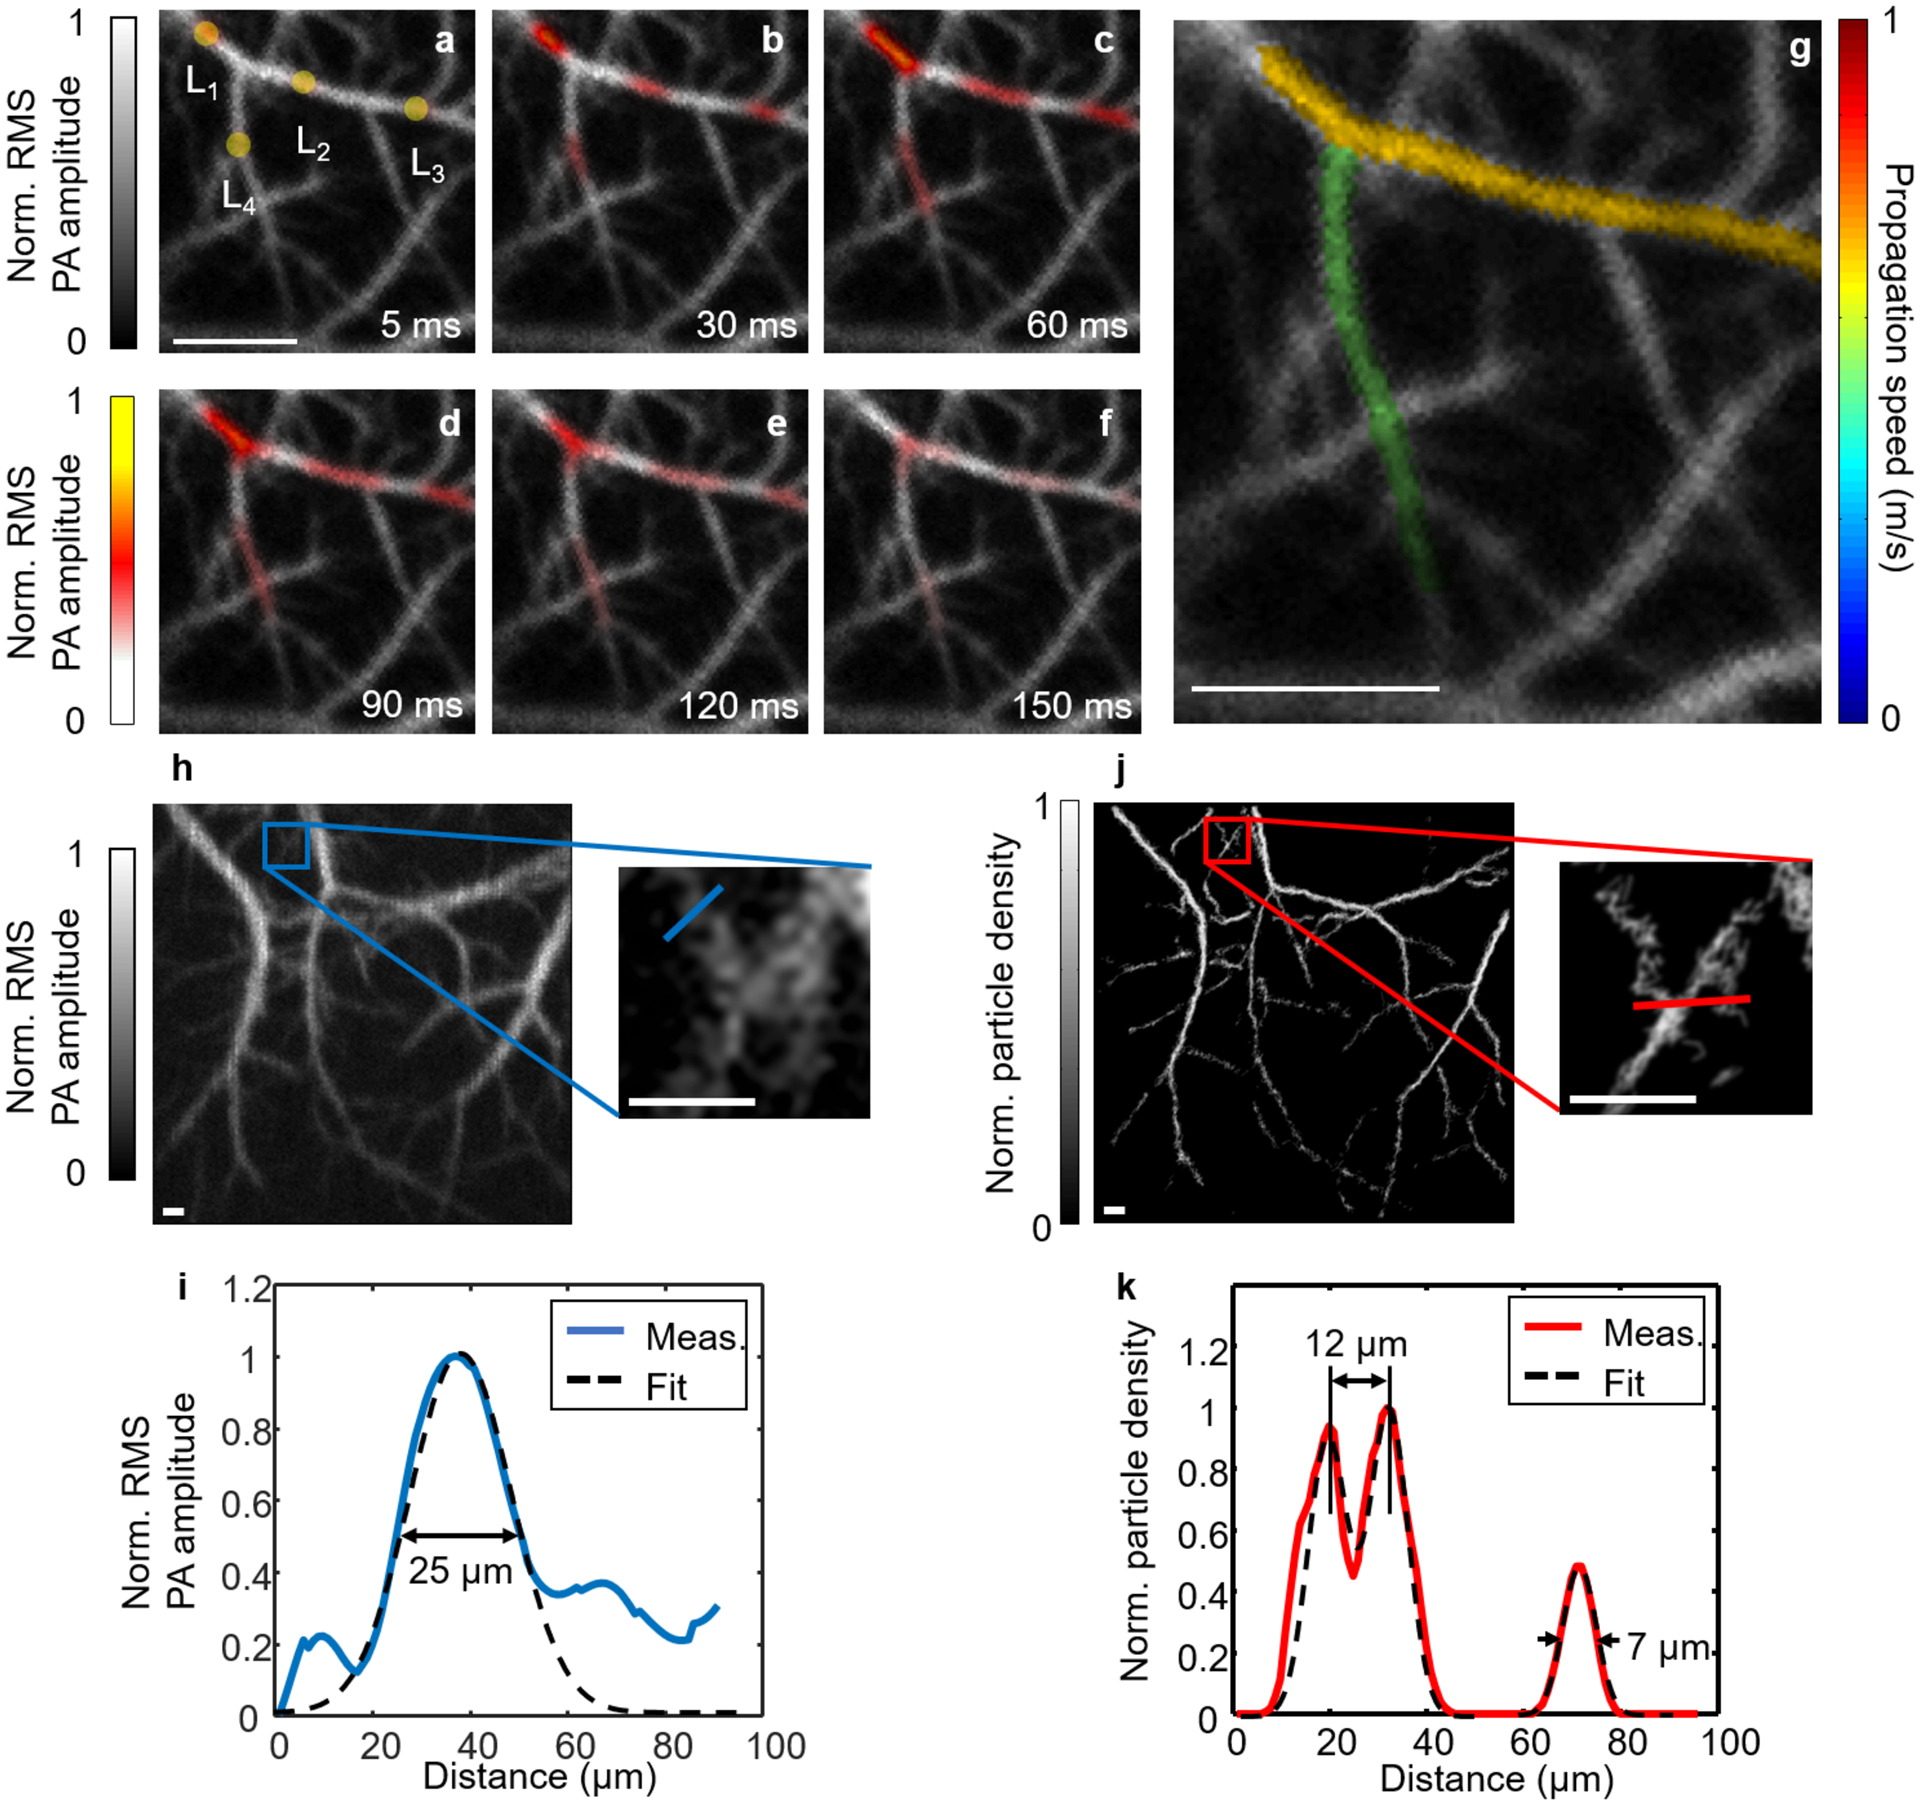
PATER of biological dynamics in vivo. (a–f) Widefield images showing thermal wave propagation in the mouse middle cerebral arteries. The yellow circles in (a), labeled L1–L4, indicate locations of the laser heating spots during recording. The overlay images show the thermal wave signals in color and the background blood signals in gray. Norm., normalized. (g) Map of pulse wave velocity at two branches of the middle cerebral arteries. (h) Calibration image of the mouse brain and a zoomed-in view of the blue boxed region showing a group of small vessels. Scale bars in (a) and (g), 500 μm. (i) Plot of the profile along the blue line in the zoomed-in view in (h) and a Gaussian fit. Meas., measurement. (j) Localization map of circulating tumor cells and a zoomed-in view of the red boxed region showing the same region as the blue boxed region in (h). Scale bars in (h) and (j), 100 μm. (k) Plot of the profile along the red line in the zoomed-in view in (j) and a three-term Gaussian fit. The two neighboring vessels branching out from each other can be separated at a distance of 12 μm, and the FWHM for the small vessel is 7 μm. Images in this figure are adapted from ref. 10. All animal procedures were approved by the Institutional Animal Care and Use Committee of California Institute of Technology.
