Fig. 5.
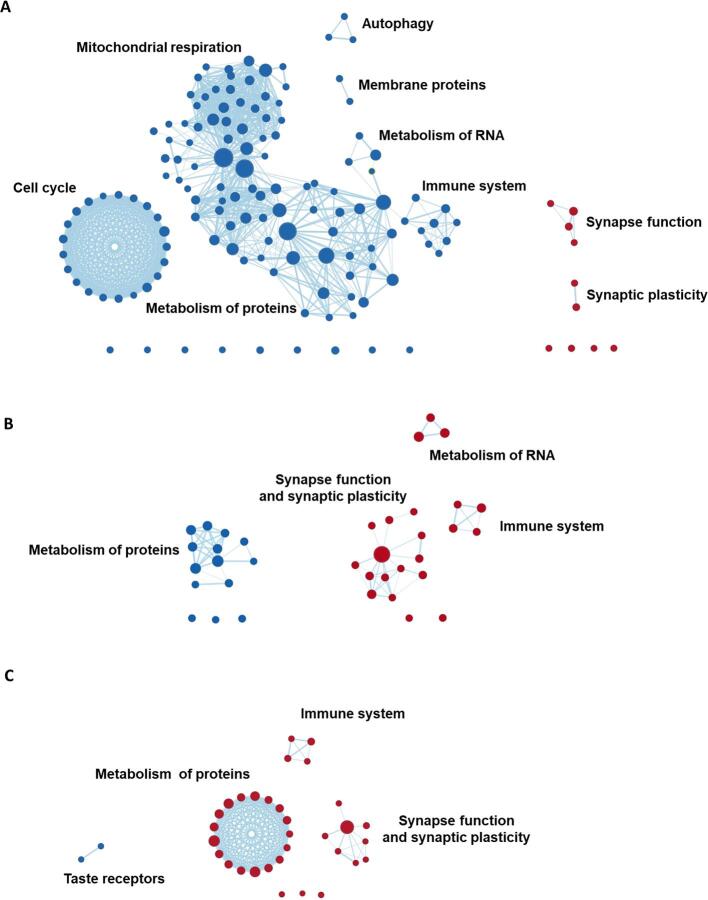
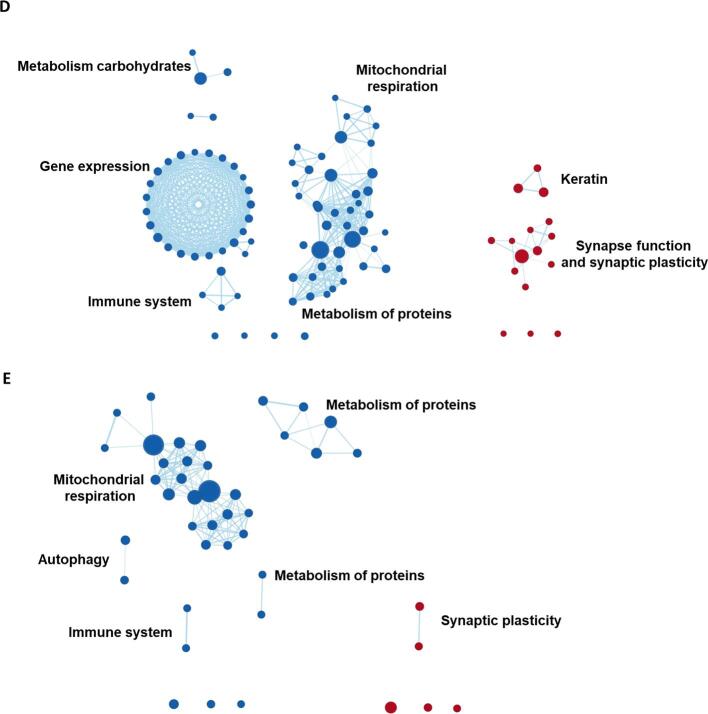
GSEA results grouped into clusters of gene sets. Displayed are the results from gene set enrichment analyses and the clusters represent groupings of gene sets, variations in gene expression levels of which are spatially associated with regional GM volumes in AD-Memory, AD-Executive, AD-Language, AD-Visuospatial and AD-No Domains. Red nodes represent gene sets that are positively enriched (lower volumes -> higher gene expression) while blue nodes are negatively enriched. The size of the nodes represent the size of the gene set, larger nodes signify gene sets with more genes included. The thickness of the edges corresponds to the number of genes that overlap between two gene sets (i.e., nodes). Grouping of gene sets into clusters was achieved by assessing shared biological functions across gene sets (by Cytoscape software) and clusters were named (by the authors) according to that common biological function. Idle nodes represent gene sets that did not overlap with other gene sets and could therefore not be clustered into groups. Leading-edge analyses (to detect the most relevant genes driving the groupings) are presented in Fig. 6. (For interpretation of the references to colour in this figure legend, the reader is referred to the web version of this article.)


