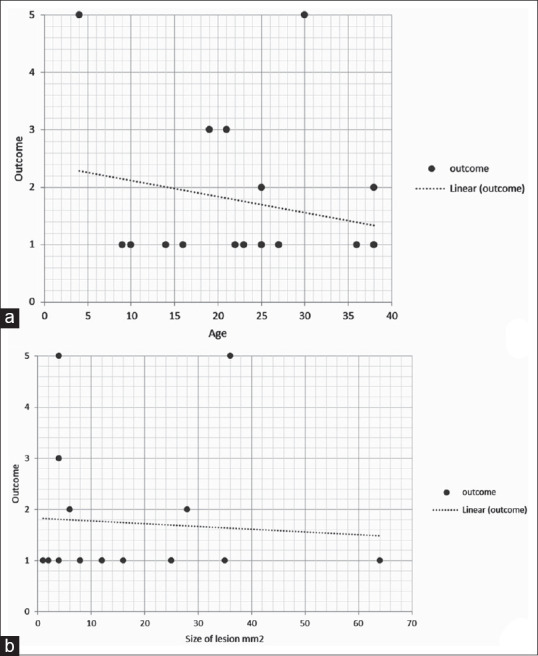
Figure 3.

X-Y scatter graphs along with trend lines to correlate treatment outcomes. The X-axis represents age in years (a) and size of the lesion in mm2 (b). The Y-axis represents treatment outcome among five categories, where one indicates excellent response and five indicates nonresponder
