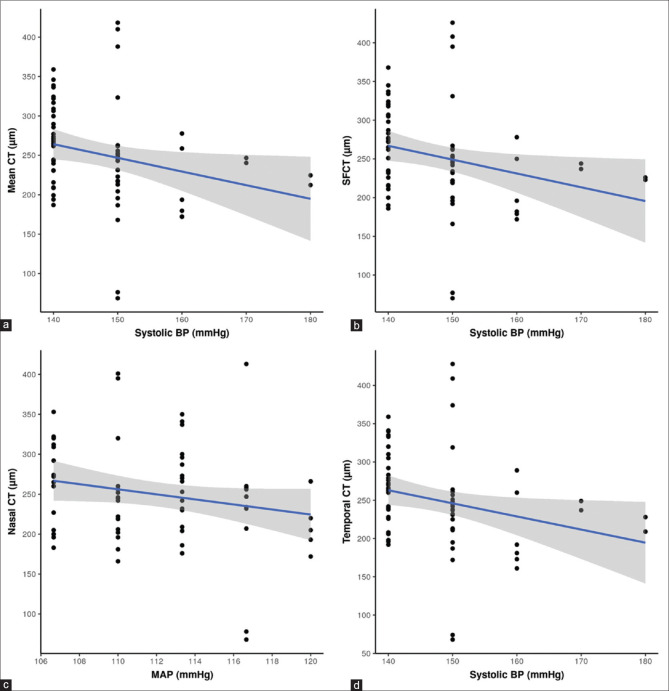
Figure 2.
Scatterplot presentation of correlation analysis between the systolic blood pressure and mean choroidal thickness (a), subfoveal choroidal thickness (b), nasal choroidal thickness (c) and temporal choroidal thickness (d) in Group B. The blue lines represent the general trend of correlation between the two variables. The shaded grey areas represent the 95% confidence interval of these trendlines

