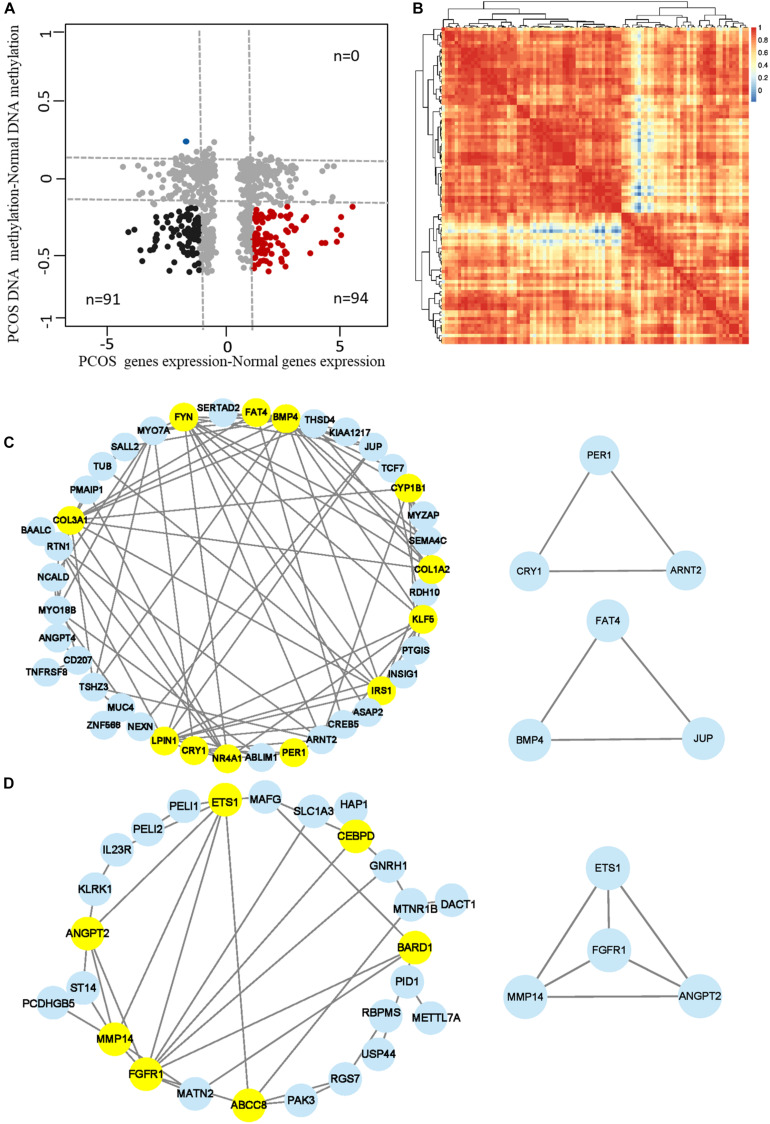
FIGURE 4.
Identification of the hub methylation marker genes in PCOS. (A) Scatterplots showing the comparison between transcriptome and the DNA methylome. Genes with significant changes in DNA methylation levels (abs change >0.2) and expression levels (abs log2 fold change >1) were defined as “methylation-affected genes.” Hypermethylation-affected downregulated genes were labeled in blue; Hypomethylation-affected upregulated genes were labeled in red. (B) Heatmap showing the module clustering of 94 methylation-affected upregulated genes by Pearson correlation coefficient. (C,D) Network diagrams showing interaction of genes in the two modules that were obtained in panel (B). Hub node genes were highlighted by yellow. The genes in the small networks are highly connected in the networks calculated by module mining.

