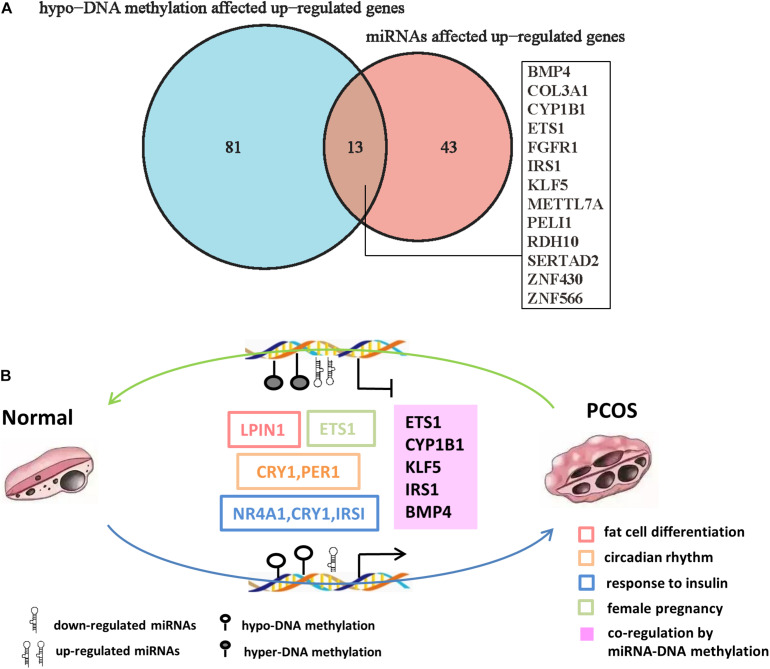
FIGURE 6.
The DNA methylation and miRNA coregulation profile in PCOS. (A) Venn diagram showing the genes that are coregulated by downregulated miRNAs and reduced DNA methylation in PCOS. (B) Coregulation of DNA methylation and miRNA in PCOS. The key molecular markers and pathways are labeled in different colors. The hollow box represents the signaling pathway where the marker genes are involved, and the solid box represents the genes that are coregulated by miRNA and DNA methylation.

