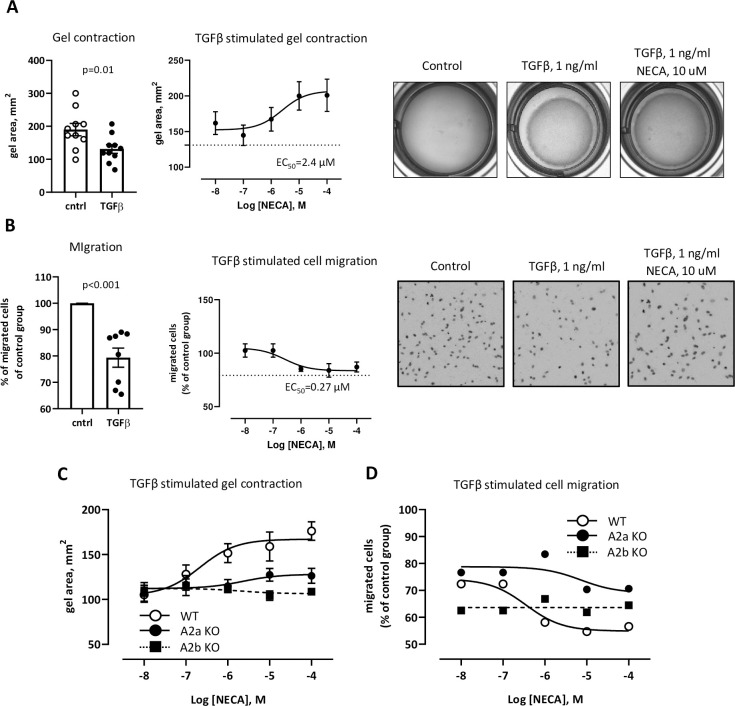
Fig 2. Effect of adenosine on fibroblast migration and gel contraction.
A) Gel contraction assay of mouse mammary fibroblasts. Graphs show gel area, mm2. Left plot demonstrates control vs. TGFβ. *—p<0.05 vs. control. Right, logged plot, demonstrates NECA influence on TGFβ induced effect. Mouse mammary fibroblasts were embedded to collagen gel and cultured 24 hr. TGFβ (1 ng/ml) was added for 6 hr. with following measurement of gel diameter. For dose-dependent experiments NECA (0.01 uM– 100 uM) was added together with TGFβ. Dotted line is a TGFβ only. B) Migration assay of mouse mammary fibroblasts. Graphs show % of migrated cells of control group which is used as 100%. Left plot demonstrates control vs. TGFβ. *—p<0.05 vs. control. Right logged plot demonstrates NECA influence on TGFβ induced effect. Mouse mammary fibroblasts were placed on the top of 24 wells insert and cultured for 3 hr. in presence of TGFβ (1 ng/ml) and NECA (0.01 uM– 100 uM). Dotted line is a TGFβ only. C, D) Logged plots of gel contraction and a migration assays of primary mouse mammary fibroblasts isolated from mouse mammary gland WT and A2a-KO, and A2b-KO animals. Graphs show gel area, mm2 for gel contraction or % of migrated cell over the control group. TGFβ and NECA concentrations are the same as in A and B.

