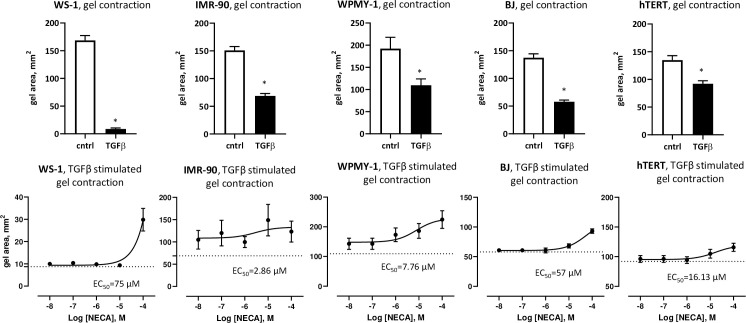
Fig 5. Adenosine/TGFβ interaction in human fibroblasts.
Gel contraction assay of human fibroblast cell lines. Graphs show gel area, mm2. Top raw demonstrates control (cntrl) vs. TGFβ (1 ng/ml). *—p<0.05 vs. control. Cell lines were embedded to collagen gel and cultured 24 hr. TGFβ (1 ng/ml) was added for 6 hr. with following measurement of gel diameter. Bottom raw, logged plot, demonstrates NECA influence on TGFβ induced effect. Cell lines were embedded to collagen gel and cultured 24 hr. TGFβ (1 ng/ml) and NECA (0.01 uM– 100 uM) were added in same time for 6 hr. with following measurement of gel diameter. Dotted line is the TGFβ only.

